Gantt Chart Elements
The following section will walk you through the elements of your Gantt chart panel and explain how to accomplish many common tasks.
Toolbar
Using the toolbar, you can:
- Access Gantt Chart Settings
- Show/hide resources
- Adjust the chart's appearance
- Select which elements are shown within your timeline
- Create dependencies
- Turn tasks into milestones
Apply Resource Leveling
Toggle Sandbox mode on/off
Manage Baselines
 Timeline
Your timeline contains visual representations of tasks, dependencies, progress, milestones and other key dates.
It is also where you will do most of your work. You can also adjust tasks and dependencies directly from your timeline.

Time Scale
You can quickly navigate or focus your timeline in a variety of ways:
- Zoom in or out to see more or less of your timeline
- Scroll horizontally or vertically
- Hold the Shift key and drag the chart with your pointer
- Focus in on the current date with the Today button
- Navigate to the current task with the Scroll to Task button (only appears if the currently-selected task is not visible)

Zoom Level
To adjust the zoom level of your chart, use the + or - magnification buttons in the toolbar.
You can also zoom in or out using your mouse wheel, by holding down the ctrl button (cmd on macs).
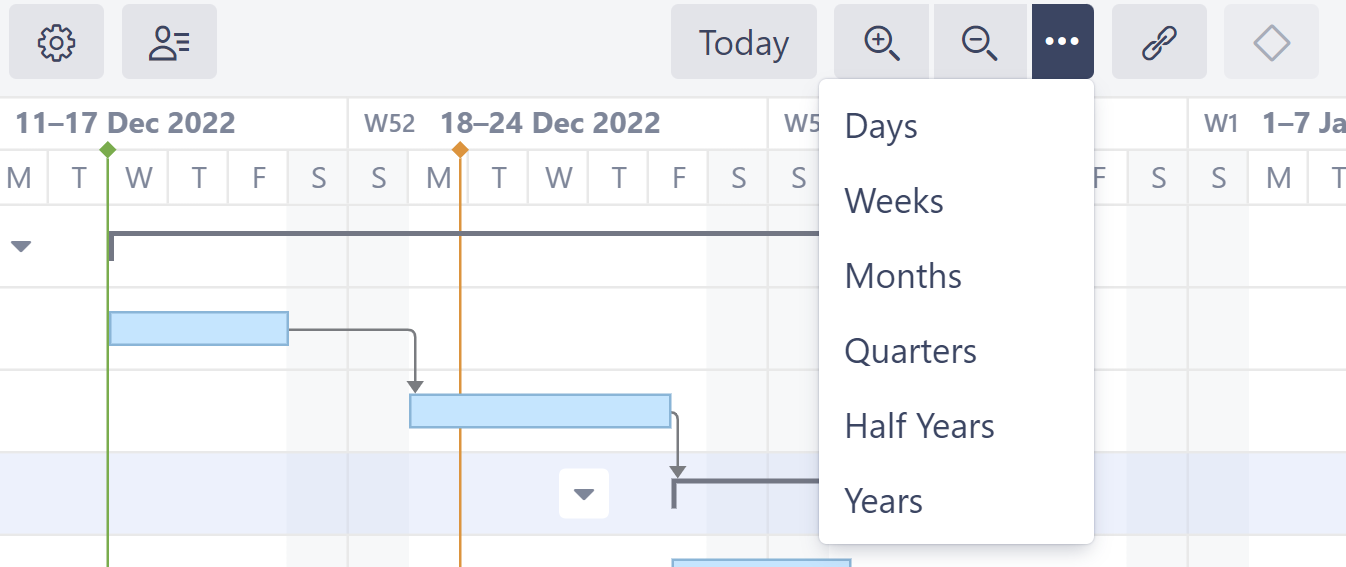
To view issues based on a specific time scale, such as weekly or monthly, use the press the three dots beside the magnification buttons.
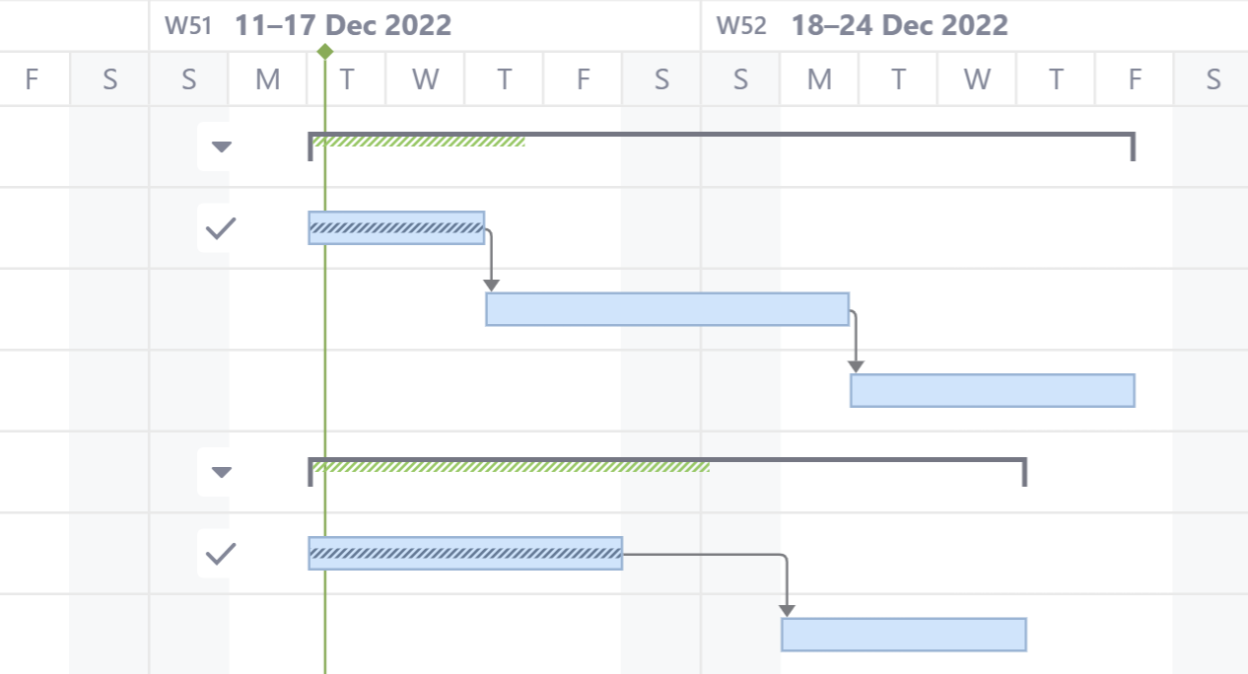
Week Numbers
If you zoom out to a point that weeks are shown, Structure.Gantt will list both the dates and the corresponding week numbers:

Start Day and Current Date
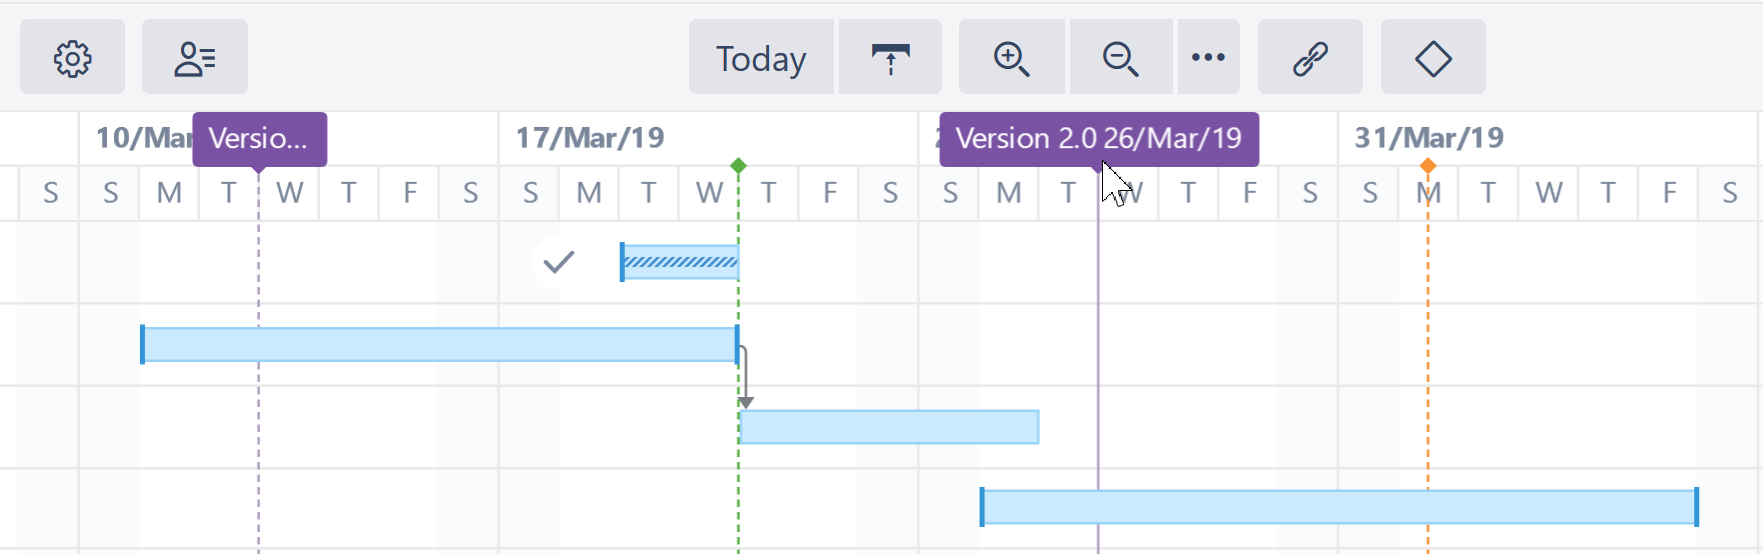
The project start date is indicated by a green vertical dashed line. The current date/time is indicated by an orange vertical line.
Mousing over the point at the top of either line will display the exact date.

Fix Versions
Fix Version markers display version names. By hovering over a marker, you can also see the release date and project key (if versions are shown for multiple projects).
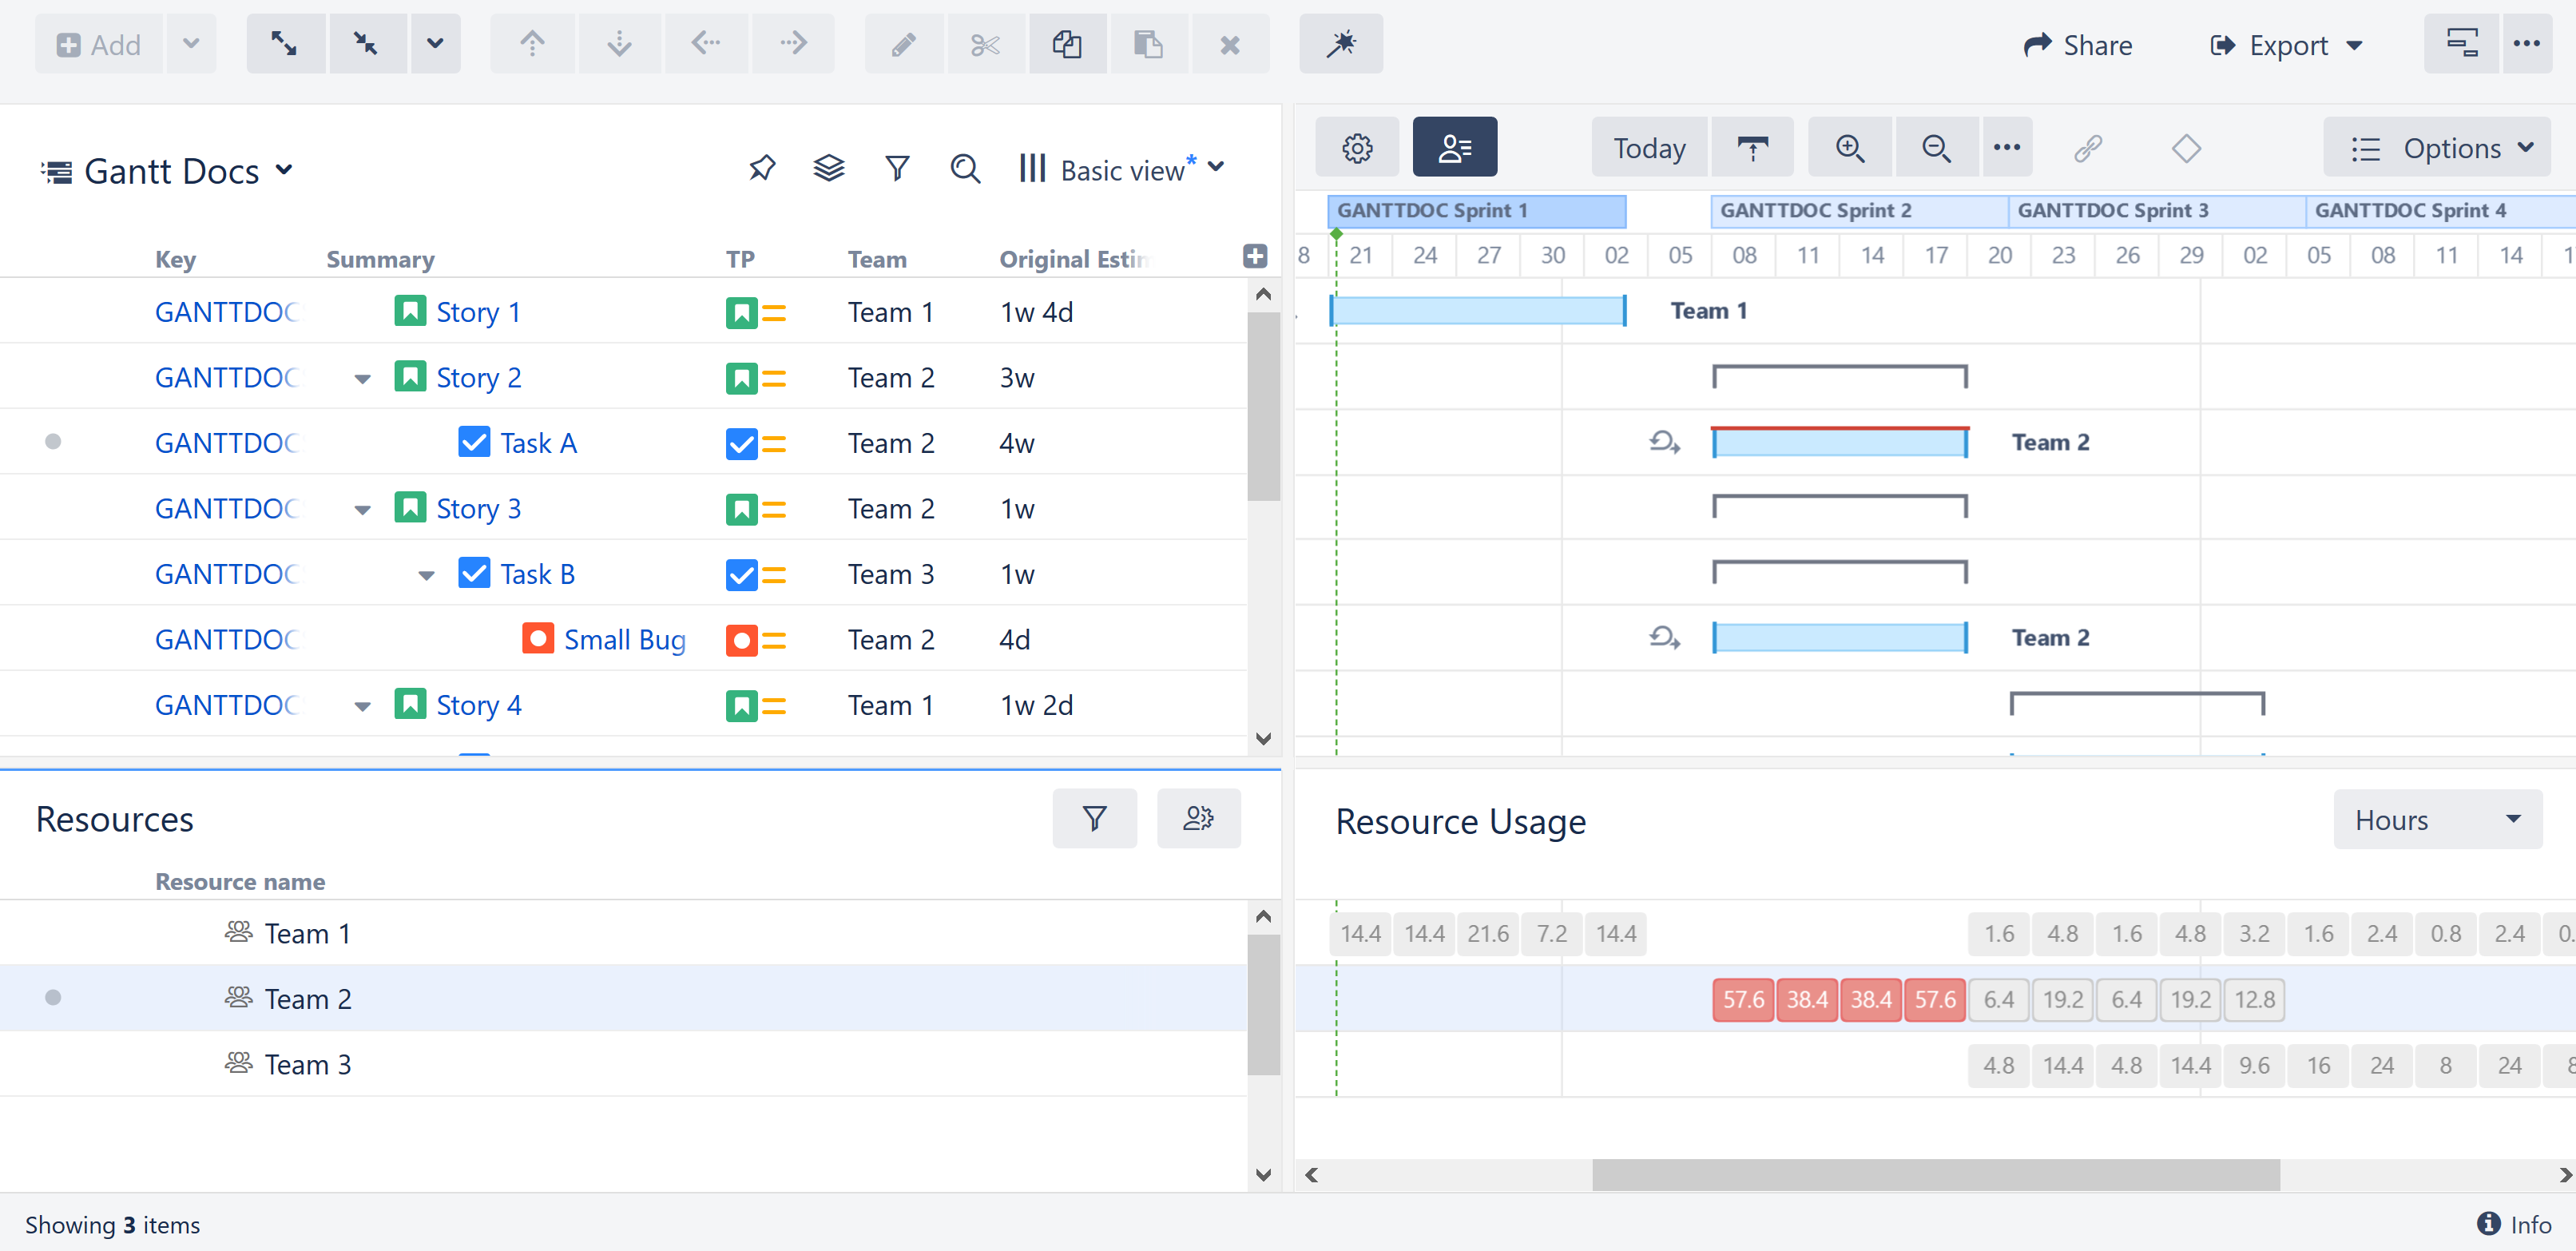
Sprints
If the highlighted task is manually scheduled by sprints, sprints from the corresponding board will be displayed at the top of the timeline when the task is selected.
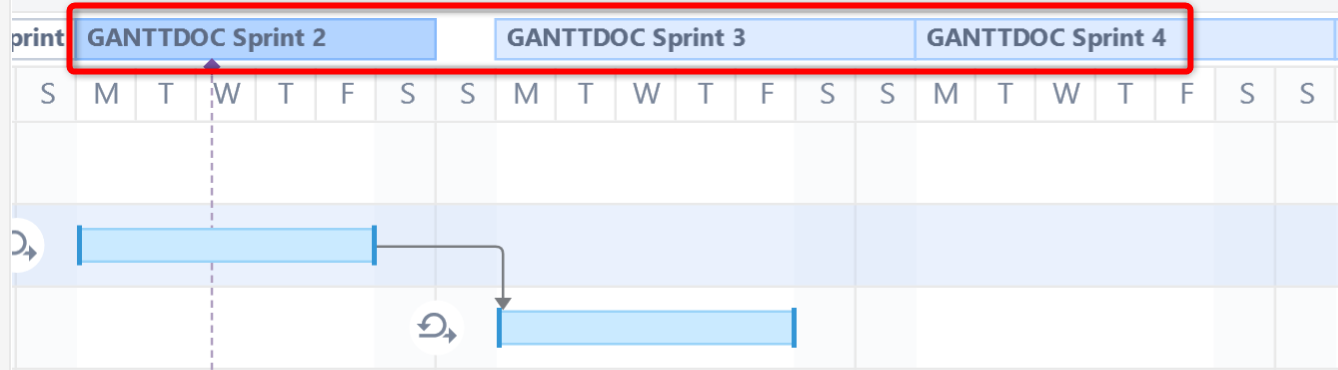 Sprints are visualized based on sprints already defined in a Jira board or anticipated sprints based on your chart settings. (See Gantt Chart Settings for instructions on specifying sprint timelines.)
Task Bars
Structure items are represented in the chart as task bars.
- A task's position on the timeline is based on its dependencies, manually-set Start or/and Finish dates or sprint dates, and Leveling Delay.
- If you have configured Gantt to track the progress of tasks, that will be shown inside the bar. To show/hide progress, use the Display Options menu.
- Completed tasks can be marked with a check icon. To show or hide Task Indicators, use the Display Options menu.
- If a task is a part of the critical path, it is shown with a red box around it. You can show or hide critical path highlighting using the Display Options menu.
Groups
If an element has children in a structure, it can be shown as a Group.
- A group's Start Date and Duration are calculated automatically, based on the Start Date and Duration of the elements it contains.
If the group is an issue which has its ownstart/finish dates and estimate values, these are ignored.
Progress for the group is calculated as an aggregation of its children's progress, and the element's own task progress is ignored as well.
Expanding/Collapsing Groups
To show or hide the tasks within a group, click the triangle to the left of the group.
In order to display child/parent relationships as a group, you first need to enable grouping in Gantt configuration
Dependencies
Dependencies are displayed as arrows between task bars.
- Click the arrow to show the Dependency Properties
- To show/hide dependency arrows, use the Options menu in the toolbar

For more information about managing dependencies, see Dependencies Configuration.
Resources
To view resource allocation on you Gantt chart, click the Resources button in the Gantt toobar.
The Resources section of your chart is split into two panels:
- Resources - Displays a list of all resources based on your Resources Configuration.
- Resource Usage - Displays the workload for each resource at a given time.
For more information about managing resource, see Resources and Resource Usage.
Critical Path
The critical path highlights items that directly affect the project's end date. It includes the task with the latest Finish Date, as well as any items that, if delayed, will also delay that last task - and extend the project's end date.
If a task is part of the critical path, it is shown with a red box around it. The dependencies that make up the critical path are also shown in red.

To switch off Critical Path highlighting:
- Select the Options menu in the toolbar
- Uncheck Critical Path
The critical path does not affect your chart or the issues within it in any way - it's simply a visual indicator.
Display Options
The Options menu allows you to select what elements should be shown in the chart.
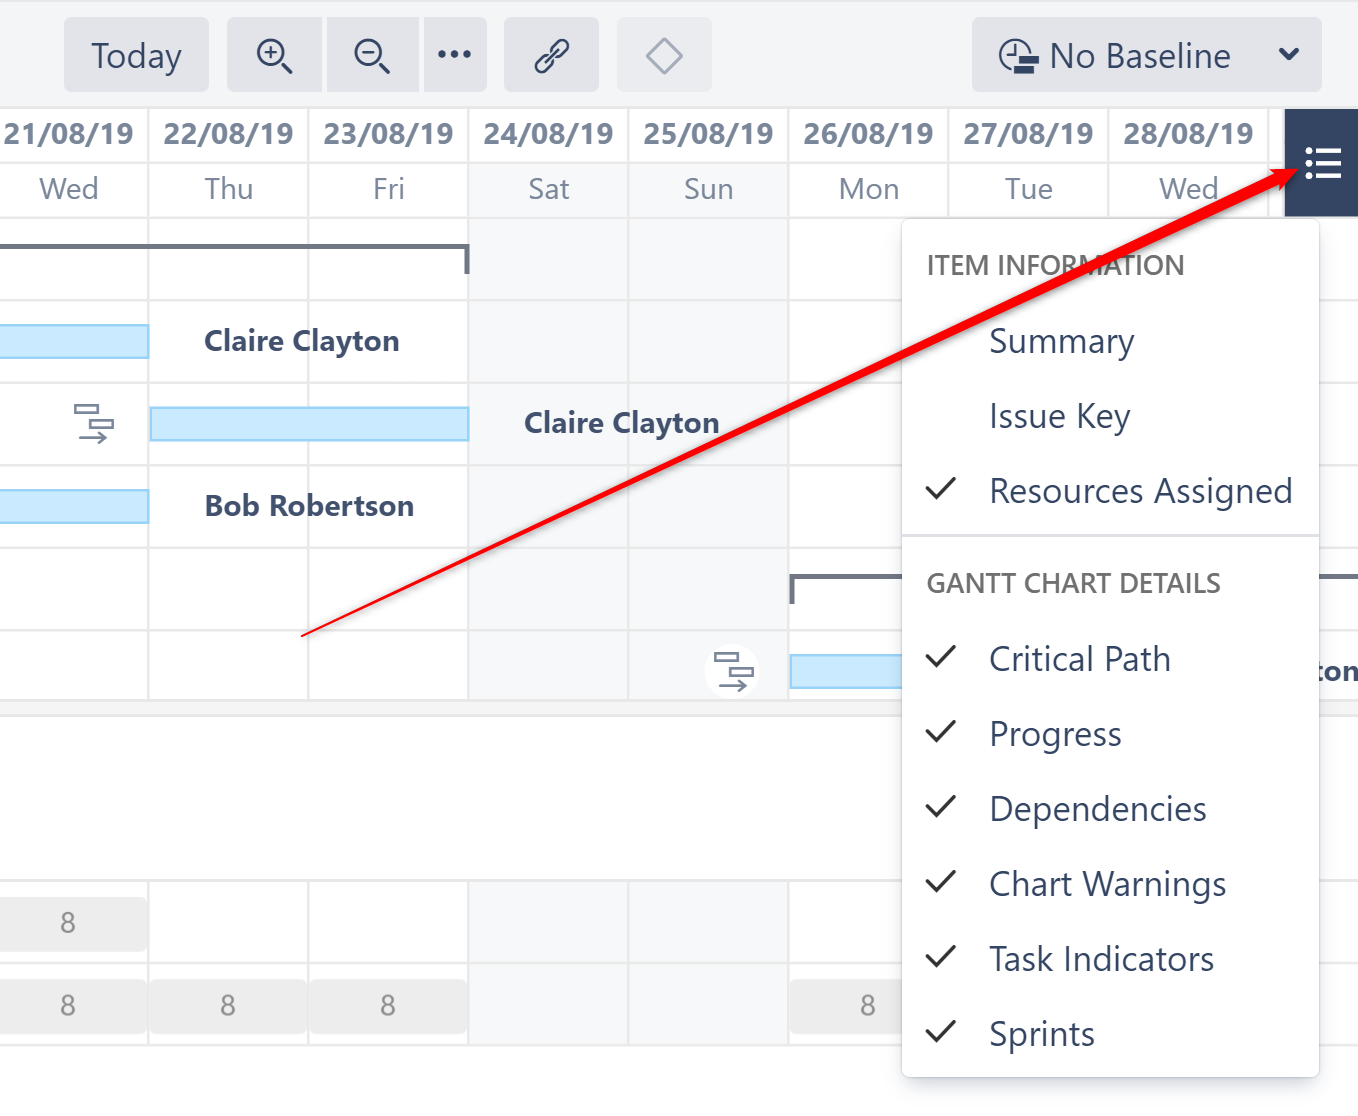
You can show/hide:
- Summary
- Issue Key
- Resources
- Critical Path
- Progress
- Dependencies
- Chart Warnings (such as another time zone or different calendar)
- Task Indicators (see Task Indicators)
- Sprints (Note: If this option is switched off, sprints will still be displayed when dragging sprint-scheduled tasks.)
- Custom chart markers
Status Bar
If there are any inconsistencies in the source data (for example, a cycle of dependencies), the Gantt Info link will be shown on the right side of the Structure status bar (next to the Structure Info link ![]() at the bottom of the screen). Click the link to see details of the inconsistencies.
at the bottom of the screen). Click the link to see details of the inconsistencies.

If you do not have permission to edit the Gantt chart, that information will be displayed in the Status Bar as well.