Predictive Cumulative Flow Diagram
Most of the information leadership wants to see can be found on the Predictive Cumulative Flow Diagram (PCFD). The PCFD provides a visual interpretation of past work, predicted future work, and estimated completion dates for each team.
The following section provides a guide to the different elements of the PCFD.
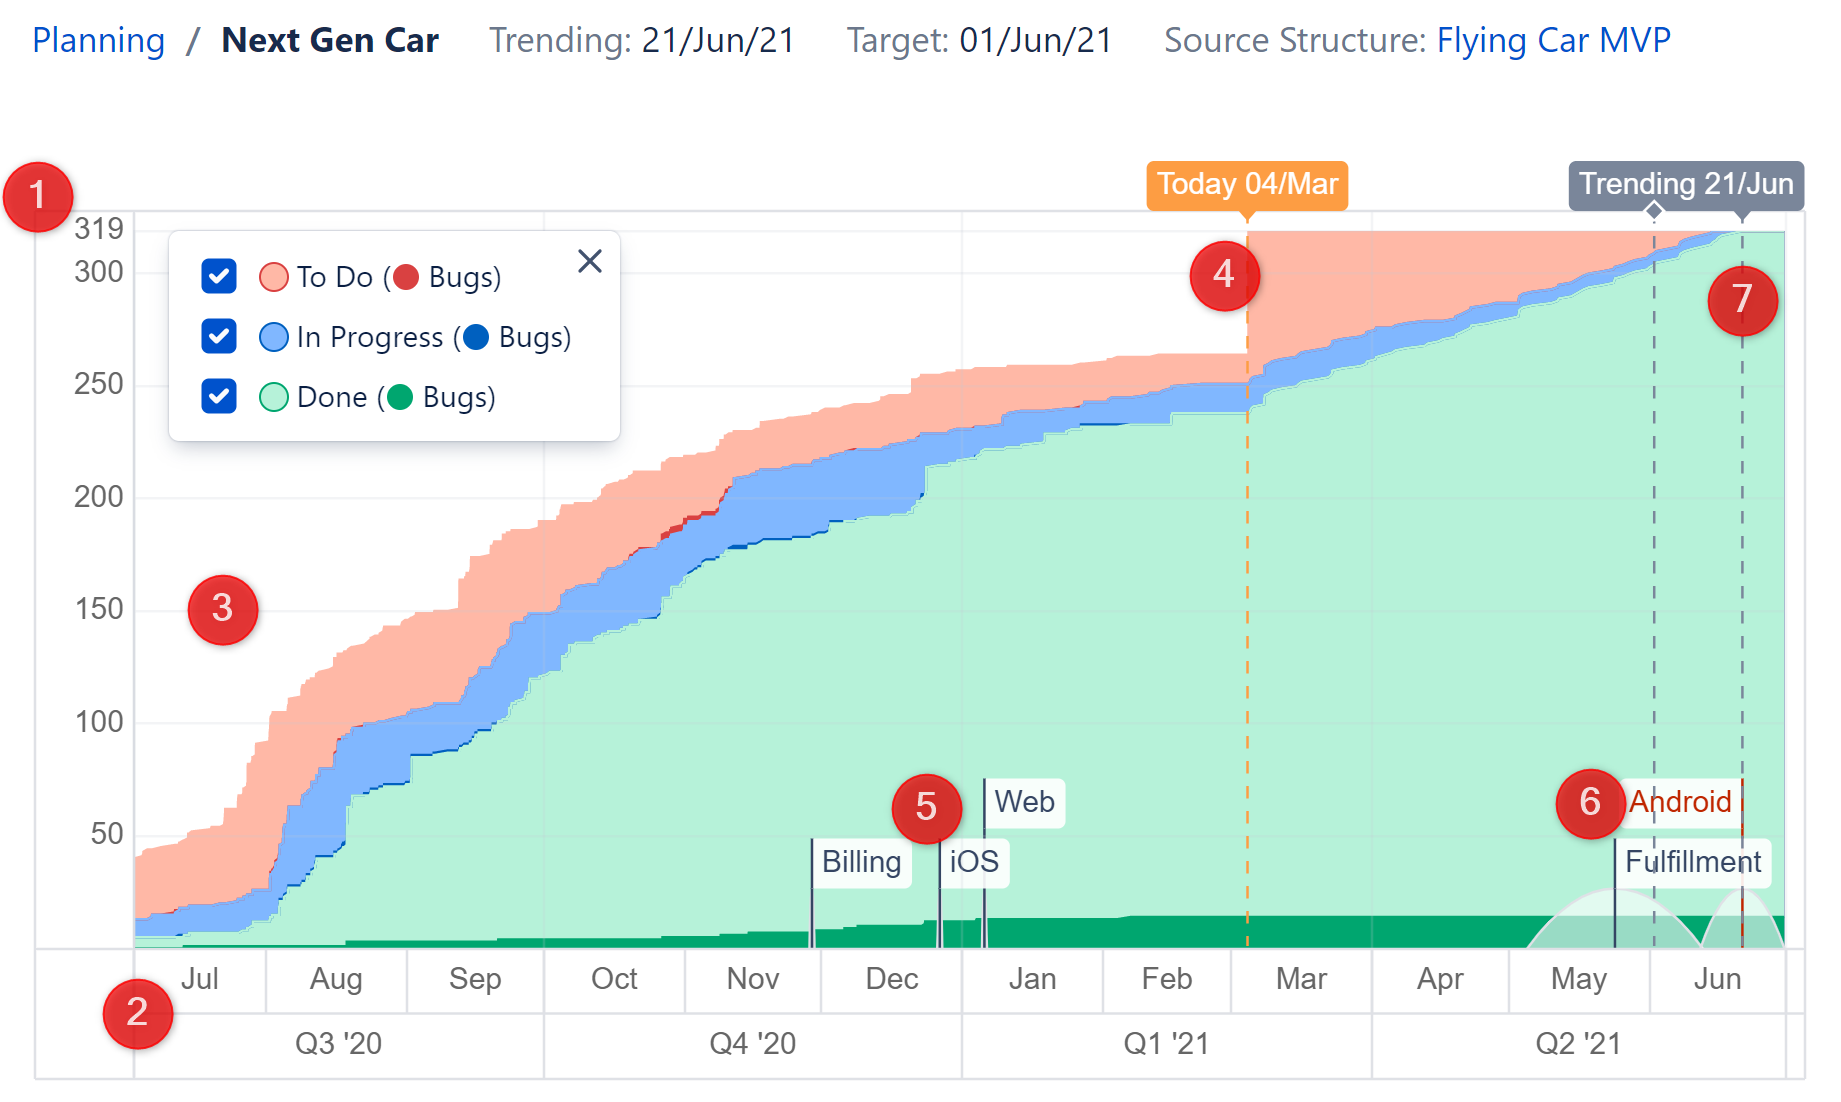
1 Issue Count
The vertical axis of the PCFD shows the number of issues in the delivery. The total issues are a combination of the actual issues in the source structure plus the issues Structure.Deliver predicts each team will generate in the future as part of their Agile grooming process.
2 Timeline
The horizontal axis of the PCFD shows the predicted timeline for the delivery. The timeline is broken into two section, divided at the Today line: the section on the left represents historical data, while the section to the right of the Today line offers a prediction of how issues will be added and moved through the workflow until the delivery is completed.
See Today Line for more information.
3 Cumulative Flow
This area of the PCFD shows issues in three status sets:
- todo - the red section of the chart represents those issues that have been added to the delivery but have not yet been worked on
- in progress - the blue section of the chart represents issues that are actively being developed
- done - the green section represents issues that have been completed
Quality tracking
Each status area on the graph has a darker color that represents quality-related issues (such as bugs), based your settings. Any issues that are configured as related to quality will be shown in a darker color in all graph status areas. This makes it possible to track when a backlog of quality work is accumulating in todo, when the team is focused on quality work or not, how much quality work is getting done, and when in the timeline all this activity occurred.
4 Today Line
The Today line indicates when the graph transitions from a historical record to a predictive simulation.
Historical CFD
The section of the chart to left of the Today line represents a traditional cumulative flow diagram:
- Total issue counts and workflow data is based on historical data available in Jira.
- Team markers on the left side of the chart indicate the date each team completed their scope for the delivery.
Predictive CFD
The section to the right of the Today line represents Deliver's predictive simulation for the remainder of the delivery:
- You will often notice a large increase in "todo" items (the blue section) at the Today line. This is where Structure.Deliver adds all the new issues it predicts will be created between today and the end of the project.
- Transitions through the workflow are based on calculations of each team's past performances.
- Team markers on the right side of the chart indicate the date Structure.Deliver predicts each team will complete their scope.
5 Completed Teams
When a team completes all their scope for a delivery, a marker is placed on the PCFD at the date they completed their last issue. Structure.Deliver no longer performs any predictive analytics for completed teams. If a completed team adds additional scope, either in their backlog or by editing their metrics, the team marker will be replaced at the date Structure.Deliver predicts they will complete this new scope.
6 Working Teams
A marker is placed on the PCFD at the date each team is predicted to complete its last issue for the delivery. The area around the marker is shaded to indicate the predicted window for completion. Some teams are highly predictable, while others less so. The shaded area will be larger for teams when Structure.Deliver detects high levels of variance in their work cadence.
7 Trending Line
The trending line indicates when the last team is predicted to complete its last issue – the trending date for the delivery. If all team trending dates are before the target date, the labels for trending will be green. If any team's trending date is beyond the target date, the trending label will be red. A grace period can be set in the Delivery settings that will allow a team to trend a little late without triggering a red flag.