About Structure.Gantt Early Access Program
Structure.Gantt is a Structure extension that allows you to visualize and edit plans with a Gantt chart based on your structures.
In this document we assume that you're familiar with the basics of Structure add-on for JIRA and have it installed on your test server. If you're new to Structure, please check it out on the Atlassian Marketplace or feel free to play with it on our Live Structure Demo Server . You need to have Structure version 4.0 or later installed to be able to try Structure.Gantt extension.
This first version of Structure.Gantt contains the foundational features for the product, plus some features for calendar-based planning. The following main use cases may be tried with the current feature set:
- Visualizing manually planned tasks and their progress, based on time tracking fields and a custom field.
- High-level planning with dependencies visualization and manipulation, at a team or company level.
- Finding conflicts and critical path based on manually scheduled tasks and dependencies.
Please note that this is a preview version with limited functionality. The main goal of this release is to give you the general idea of our Gantt Chart look-and-feel, show how the main functionality works and give an idea of where we are going. Any feedback and ideas will be greatly appreciated and incorporated into future releases where possible. Please feel free to leave your comments in the Gantt Google Group.
You can see what is currently planned for the upcoming releases in the Structure.Gantt Roadmap.
Installation
Important: Structure.Gantt works with Structure 4.0 or a newer version, so please make sure you have the correct version installed.
Since this is a private preview release, Structure.Gantt is not available on the Atlassian Marketplace and should be installed via file upload (Administration | Add-ons | Manage add-ons | Upload add-on).
Creating Your First Gantt Chart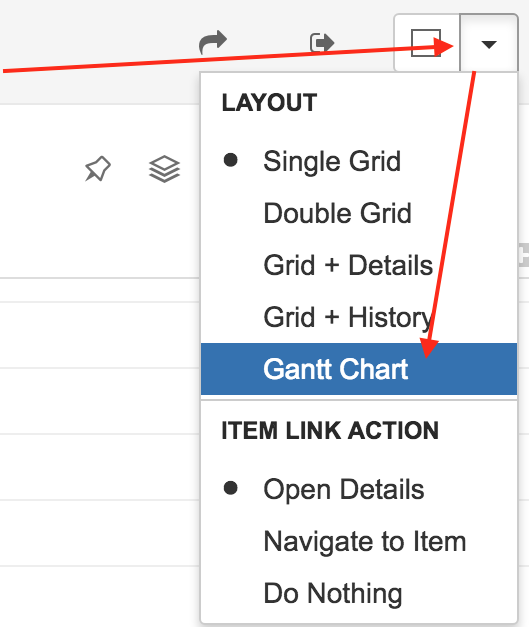
- Open Structure Board and switch to a structure with some issues in it.
- Use Layout menu to switch Gantt Chart layout.
- The first time you open it for a specific structure, you see the Settings screen where you can set the project start date and select one of the available configurations. The add-on comes with one Default configuration, which has predefined parameters:
- Duration uses issue Original Estimate or Remaining Estimate + Time Spent if there is time logged for an issue (for issues with no estimate defined, default duration is 1 hour).
- The Finish-Start Dependency is represented with the “blocks” link.
- Manual scheduling is disabled by default. To enable it you will need to define which JIRA date or date/time custom field should be used as task Start Date (see the Gantt Chart Configuration section below).
- Click Save to save setting and create the chart.
Gantt Chart Configuration
Gantt Chart Configurations define how the chart is built. Current version supports only a limited set of parameters and options for them, but it will be expanded with new versions.
To create and define a new configuration:
- Open the Setting page by clicking the Settings button
 on the left side of the chart toolbar.
 - Click Manage next to the Configuration field to open the Gantt Configurations dialog.
- Click Create to create a new configuration, or click Edit next to one of the existing configurations.
- In the Properties tab, specify the configuration name and description.
In the Dependencies tab, specify which link type should be used to represent Finish-to-Start relationship.
Currently issue links is the only option for building dependencies in Gantt, so you need to select one of the link types to be able to create dependencies. The ability to create dependencies in Gantt without relying on issue links is planned for the next preview version.
Other types of dependencies, like Start-to-Start, are also scheduled for a later version.
In Task Duration tab you can define the default estimate for tasks without estimation in the time tracking fields.
Currently, duration is defined by the JIRA time tracking fields, so you need to have time tracking enabled to change issues duration in Gantt. Original Estimate is used for issues with no time logged. Once you log time, Remaining Estimate + Time Spent is used.
Ability to work without time tracking is coming in a next version with the support of the Finish Date parameter.
- In the Manual Scheduling tab you can enable manual scheduling. To do that you need to select a field which will be used as the task Start Date in Gantt. It can be any custom field of the date or date/time type.
Gantt Chart Elements
Once you define the configuration and save the settings, the Gantt Chart opens.
You can see the following elements.
Timescale
Use the Zoom control in the toolbar to zoom in, zoom out or select the desired zoom level.
To scroll, use the horizontal or vertical scroll bars or hold Shift key, click anywhere in the chart and drag to move the chart horizontally or vertically.
Use the Today button to navigate to the current date or the focused task button next to it to navigate to the task currently in focus.
Start Date and Current Date
Green vertical line represents the project start and the red vertical line shows the current time. Mouse over the points that represent them in the timeline to see the exact dates and time.
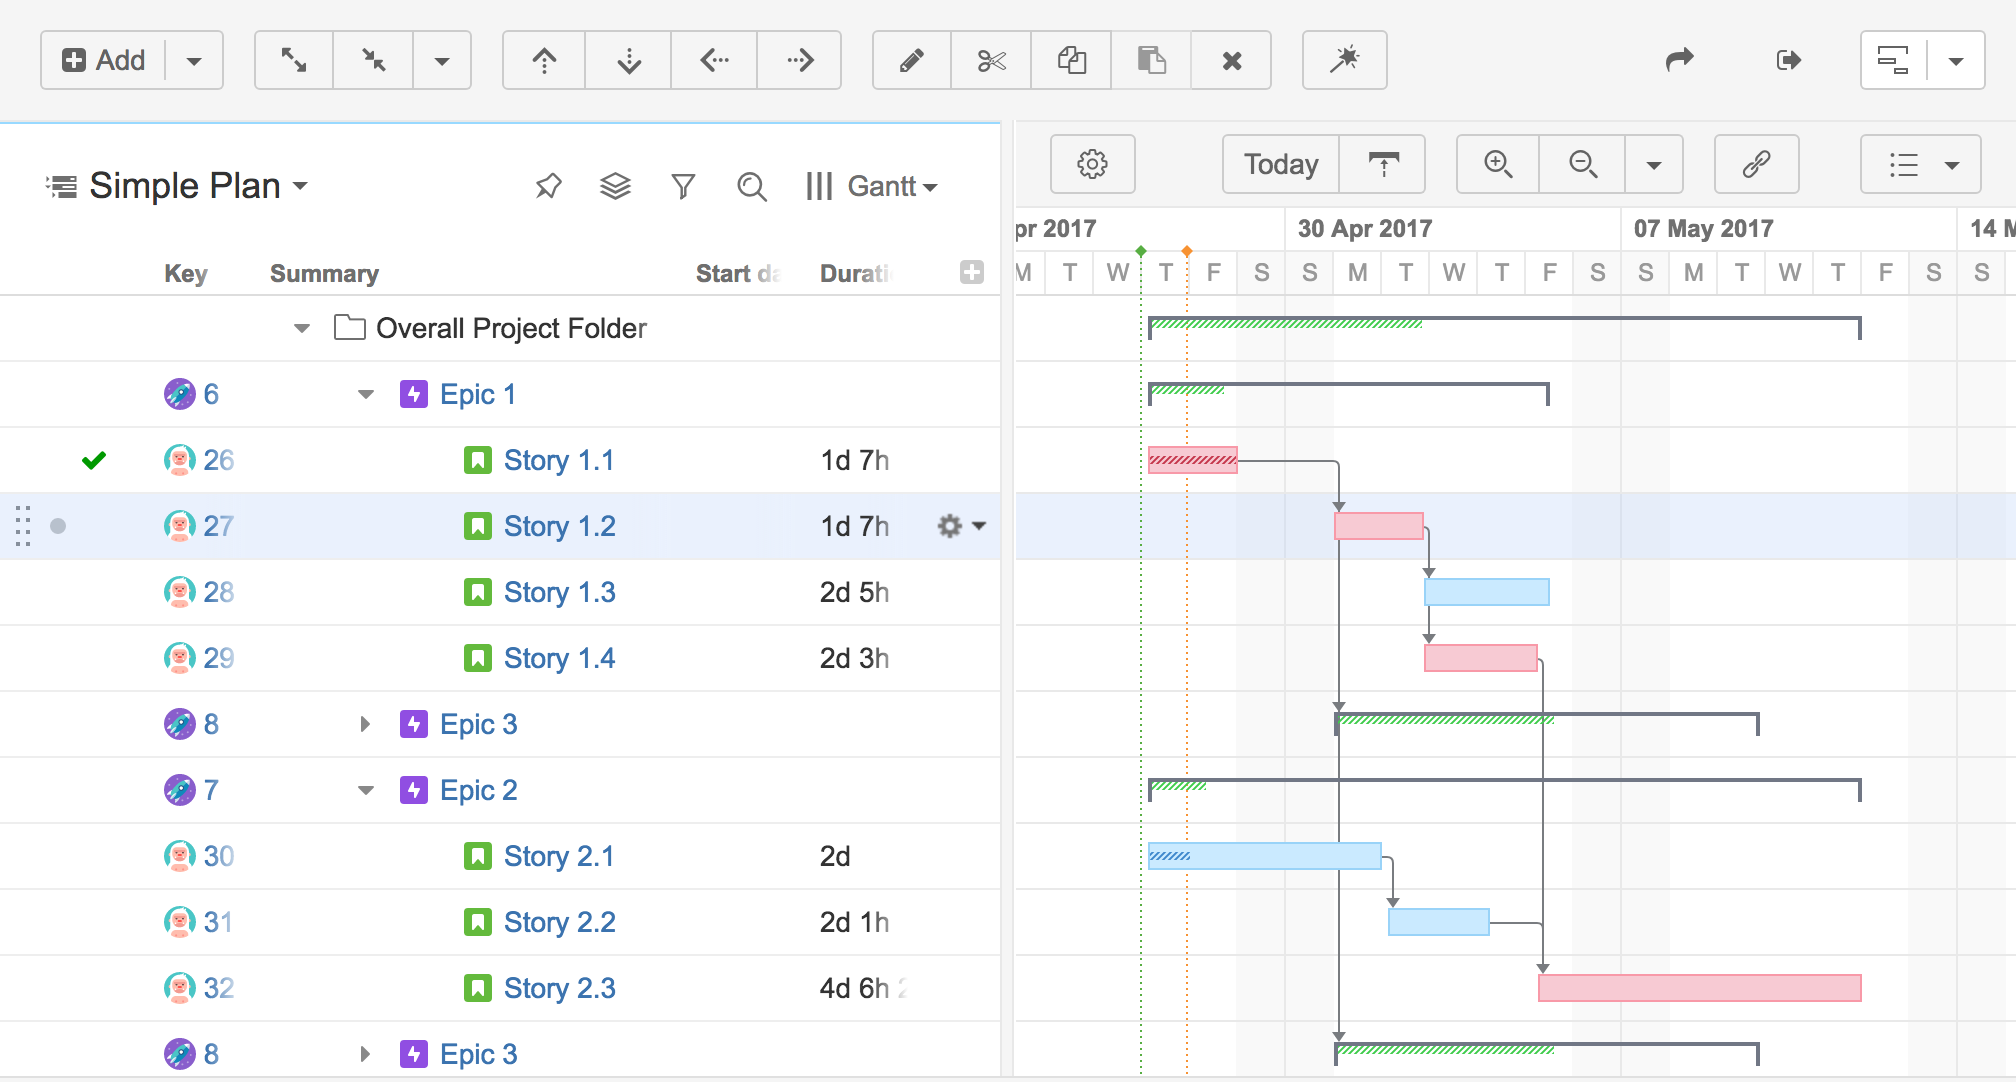
Task Bars and Groups
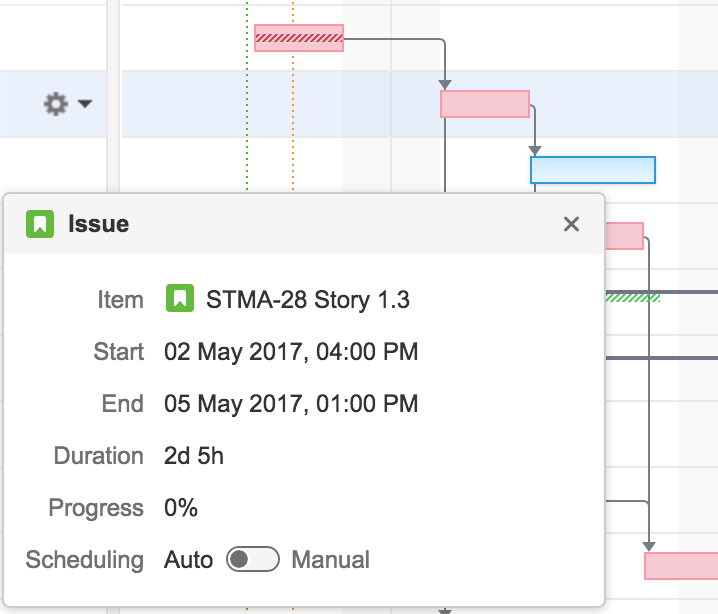
- Structure elements are represented in the chart with bars. Clicking the task bar will show the task details panel.
- Position of the task along the time axis is determined by its Start Date and exiting dependencies.
- If there is time logged for an issue, the progress is shown inside the bar. To show/hide progress, use the Options menu in the toolbar.
- If an element has children in the structure, it is shown as a Group. Group start date and duration is calculated automatically based on the start dates and duration of the elements it contains. If the group is an issue and has its own start date and duration values, they are still ignored.
- If a task is a part of the critical path, it is shown red. The rest of the tasks are blue. You can show/hide critical path highlighting through the Options menu in the toolbar.
Dependencies
Dependencies are shown as arrows between the tasks bars. Clicking the arrow will show the dependency details. To show/hide dependencies use the Options menu in the toolbar.
Additional Options
You can show issues summaries and keys next to the bars in the chart. To do that, select them in the Options menu in the toolbar.
Working with the Gantt Chart
Adjusting Start Date, Manual and Automatic Scheduling
If you have defined the Start Date field in the configuration, you can adjust the task start date in the chart by dragging it to the desired location. You can also adjust it by changing JIRA field - either on issue page or right in the structure if you have the column with your Start Date field added.
As you set the Start Date, the task is considered to be scheduled manually, which means that it will stay at the defined position regardless of its dependencies. To switch back to the Automatic scheduling mode, click the task to see the details panel and toggle the Scheduling option to Auto. This will remove the Start Date value and place the task after the task it depends on or at the project start if no dependencies exist. Removing the value from Start Date field also switches the task to Auto Scheduling.
Adjusting Duration
In the current version issue time tracking is used for duration. If no estimate is set, the default duration from the configuration is used.
To adjust duration, mouse over the right end of the task bar and once the mouse pointer changes to the resize tool, click and drag left or right to set the desired duration. The Original Estimate field value will be updated for issues with no time logged and Remaining for the issue with time logged. You can also adjust it by changing the value of the fields themselves.
Managing Dependencies
In the current version dependencies can only be based on Issue Links. Changing dependencies creates or removes links between issues (link type is defined in the configuration).
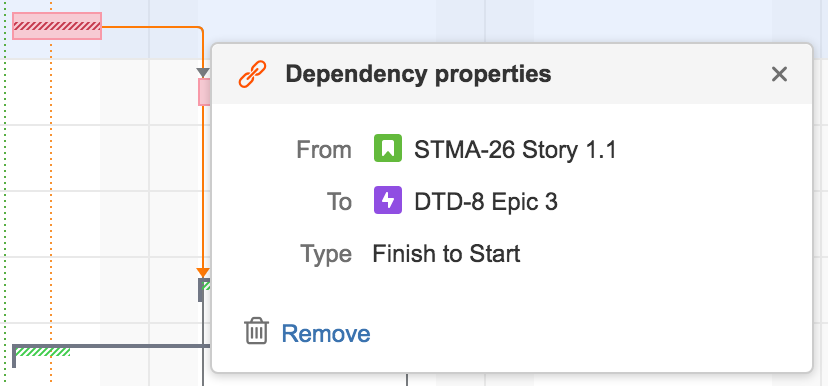
This version supports only Finish to Start dependencies. To create a new dependency mouse over the right end of the task bar and when the dot appears, click it and drag the mouse to the task you want to link it to. Once the mouse is released, the link is created. Clicking the arrow will show the Dependency Details panel.
To remove the dependency, click it and click the Remove link in the Dependency Details panel.
Another way to create a new dependency is to use the Link button in the toolbar. Click it to show the dialog, select the parent and child issues and click Create Dependency. By default, the parent issue is set to the issue currently in focus.
Critical Path
Gantt Chart can show critical path. Tasks included in the critical path are highlighted with red color. To switch off this highlighting, use the Options menu in the toolbar.
Conflicts
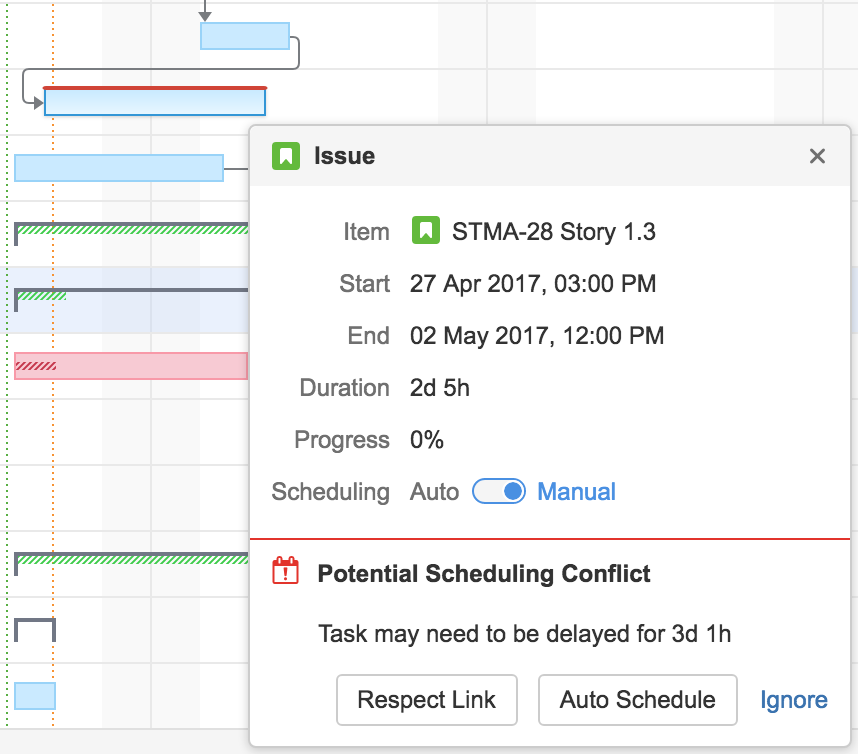
Gantt Chart is also capable of highlighting existing scheduling conflicts. The conflict exists if a certain task is scheduled for the date that is earlier than this task predecessor finish date. In such cases the task bar will be highlighted with a red line.
There are several ways to deal with a conflict. Click the task to show the details panel - the bottom of the panel will show the conflict details with several options:
- Ignore. This will remove the highlighting from the task bar, but the conflict will stay and the conflict details will stay in the details panel.
- Respect Link. Will change the task start date to coincide with the predecessor finish date. The task will stay in the Manual scheduling mode.
- Auto Schedule. Will switch the task to the automatic scheduling mode. As a result the start date will be cleared and the task bar will be placed right after the predecessor task. You can get the same results by toggling the Scheduling mode in the details panel.
Status Bar
If there are any inconsistencies in the source data (for example, a cycle of dependencies), the Gantt Info link will be shown in the Structure status bar next to the Structure Info link. Click the link to see the panel with the details.
In case of conflicting links, you will see the notification that some links were ignored and the list of those links. Click the issue key of the link to set focus on that issue and show it in the chart.
If you do not have permissions to edit Gantt chart, you will see this in the same panel.
Gantt Chart Permissions
Currently there are no dedicated permission settings for Gantt and the permissions of the structure are used. Users with View permissions can only view the Gantt Chart, users with Edit permissions can make changes (for example, set duration) and users with Structure control permissions can change the Gantt Chart settings.
All standard JIRA permissions are observed – you need Edit Issues permission to change the fields, Link Issues to create links, and so on.
Conclusion
We understand that, as of version 0.3, Structure.Gantt has just a few features to offer. However, our team has spent a lot of effort to lay foundation for a future, highly configurable, highly performant product.
We invite you stay in the loop and not get discouraged if this doesn't look like a solution for your challenges yet. Check out the Structure.Gantt Roadmap and tell us in the Google Group what's missing from the product and the plan.