While wiki markup has its limitations, you can get pretty creative and visualize more complex metrics in Structure columns, such as custom progress bars, bar charts and much more. The use of colors and images greatly expands the possibilities.
In this article, we've put together several advanced, customizable examples of wiki markup usage:
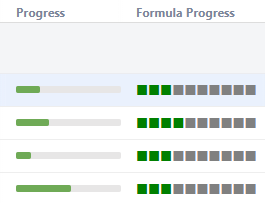
Customizable Progress Bar
In this simple example, we used Wiki Markup to create a customized progress bar. In the left column you can see the built-in progress column. In the right one, we've built a progress bar which is split into 10% sections.
We used the following formula to build the custom progress bar:
with customProgress=<formulaForProgress>: CONCAT("{color:green}", REPEAT("■", FLOOR(customProgress/10)), "{color}{color:gray}",REPEAT("■", 10-FLOOR(customProgress/10)), "{color}")
Starting with this, you can tailor the progress bar to your team's particular needs.
- Colors can easily be configured by altering the "color" values - in this case, we used green and gray squares.
- The progress calculation can be based on any percentage value. In the following example, we used an arbitrary percentage field and aggregated up the hierarchy.
with customProgress=SUM{progressField}/SUM{1}: CONCAT("{color:green}", REPEAT("■", FLOOR(customProgress/10)), "{color}{color:gray}",REPEAT("■", 10-FLOOR(customProgress/10)), "{color}")
This can be especially useful if you want to display progress based on some complex fields, like a ScriptRunner scripted field, which is not supported by the standard formula column at the moment.
Customizable Status Bars
Wiki markup can also be used to create more complex progress calculations, based on multiple issue statuses.
In the following example, we created multiple custom status bars, tracking the following statuses:
- To Do = Red
- In Progress = Orange
- Done = Green
- All Other Statuses = Gray

As with our custom progress bar, these formulas can easily be modified to adjust status colors, include additional statuses or represent each status in a different format.
Multi-bar
We used the following code to build the Multi-bar Status Bar.
//Granularity - length of the bar in characters; bar - filler character for the bar

with granularity=20: with bar = "▮":

//Lengths of bar sections per criterion in characters

with todo=FLOOR(COUNT#truthy{status="to do"}/COUNT{1}*granularity): with inprogress=FLOOR(COUNT#truthy{status="in progress"}/COUNT{1}*granularity): with done=FLOOR(COUNT#truthy{status="done"}/COUNT{1}*granularity): with other=granularity-todo-inprogress-done:

//Bar chart

CONCAT("{color:red}",REPEAT(bar, todo), "{color}{color:orange}", REPEAT(bar, inprogress),"{color}{color:green}", REPEAT(bar, done),"{color}{color:gray}", REPEAT(bar, other), "{color}")
You can change the appearance of the status simply by altering the granularity (length of the bar sections) or a using a larger symbol as we did in the Multi-bar different character example.
Multi-bar with Image
In this example, we used a simple, monochrome images (a 1x1 pixel size is enough) to make the status bar appear more solid. If you decide to try this, we highly recommend using a locally-hosted image, rather than one taken from public sources, because some hosts may block multiple successive requests for an image.
/Granularity - length of the bar chart in pixels

with granularity=200:

//Lengths of bar sections per criterion

with todo=FLOOR(COUNT#truthy{status="to do"}/COUNT{1}*granularity): with inprogress=FLOOR(COUNT#truthy{status="in progress"}/COUNT{1}*granularity): with done=FLOOR(COUNT#truthy{status="done"}/COUNT{1}*granularity): with other=granularity-done-inprogress-todo:

//Bar chart using simple square graphics

CONCAT("!https://www.example.com/images/Red.png|height=20,width=",todo,"!","!https://www.example.com/images/Orange.png|height=20,width=",inprogress,"!","!https://www.example.com/images/Green.png|height=20,width=",done,"!","!https://www.example.com/images/Gray.png|height=20,width=",other,"!")
Multi-bar with Numbers
In this last example, the status bar displays an issue count for each status, when the bar width permits. This code could be easily customized to display either the actual number of issues or their percentage.
//Parameters: granularity - length of bar-chart in characters; bar - filler of the bar chart

with granularity=20: with bar="▮":

//Tracked criteria: valueN - actual number of issues with that criterion; value - length of the criterion bar in characters

with all=COUNT{1}: with todoN=COUNT#truthy{status="to do"}: with todo=FLOOR(todoN/all*granularity): with inprogressN=COUNT#truthy{status="in progress"}: with inprogress=FLOOR(inprogressN/all*granularity): with doneN=COUNT#truthy{status="done"}: with done=FLOOR(doneN/all*granularity): with otherN=all-todoN-inprogressN-doneN: with other=granularity-todo-inprogress-done:

//Bar chart. If the number of symbols in the bar is longer by 2 characters than the length of the number of issues with the criterion, the latter number is displayed in the middle of the bar, replacing a corresponding number of filler characters

CONCAT("{color:red}",IF(todo>=LEN(todoN)+2,CONCAT(REPEAT(bar, FLOOR((todo-LEN(todoN))/2)),todoN,REPEAT(bar, FLOOR((todo-LEN(todoN))/2)+MOD(todo-LEN(todoN),2))),REPEAT(bar, todo)),
"{color}{color:orange}", IF(inprogress>=LEN(inprogressN)+2,CONCAT(REPEAT(bar, FLOOR((inprogress-LEN(inprogressN))/2)),inprogressN,REPEAT(bar, FLOOR((inprogress-LEN(inprogressN))/2)+MOD(inprogress-LEN(inprogressN),2))),REPEAT(bar, inprogress)),
"{color}{color:green}", IF(done>=LEN(doneN)+2,CONCAT(REPEAT(bar, FLOOR((done-LEN(doneN))/2)),doneN,REPEAT(bar, FLOOR((done-LEN(doneN))/2)+MOD(done-LEN(doneN),2))),REPEAT(bar, done)),
"{color}{color:gray}", IF(other>=LEN(otherN)+2,CONCAT(REPEAT(bar, FLOOR((other-LEN(otherN))/2)),otherN,REPEAT(bar, FLOOR((other-LEN(otherN))/2)+MOD(other-LEN(otherN),2))),REPEAT(bar, other)), "{color}")
Simple Burn-down Chart
You can get even more creative and use wiki markup to build mini-charts – including this simple burn-down chart. In this example, our chart displays created issues in red and resolved issues in green, with each pair corresponding to one day in a week.

Due to space limitations, there is a height limit of 20 pixels imposed within the chart, but this is more than enough to create a simple, powerful visualization.
with day1_created=COUNT#truthy{DATE_SUBTRACT(NOW(),6,"days")<=created and DATE_SUBTRACT(NOW(),5,"days")>created}:
with day1_resolved=COUNT#truthy{DATE_SUBTRACT(NOW(),6,"days")<=resolved and DATE_SUBTRACT(NOW(),5,"days")>resolved}:
with day2_created=COUNT#truthy{DATE_SUBTRACT(NOW(),5,"days")<=created and DATE_SUBTRACT(NOW(),4,"days")>created}:
with day2_resolved=COUNT#truthy{DATE_SUBTRACT(NOW(),5,"days")<=resolved and DATE_SUBTRACT(NOW(),4,"days")>resolved}:
with day3_created=COUNT#truthy{DATE_SUBTRACT(NOW(),4,"days")<=created and DATE_SUBTRACT(NOW(),3,"days")>created}:
with day3_resolved=COUNT#truthy{DATE_SUBTRACT(NOW(),4,"days")<=resolved and DATE_SUBTRACT(NOW(),3,"days")>resolved}:
with day4_created=COUNT#truthy{DATE_SUBTRACT(NOW(),3,"days")<=created and DATE_SUBTRACT(NOW(),2,"days")>created}:
with day4_resolved=COUNT#truthy{DATE_SUBTRACT(NOW(),3,"days")<=resolved and DATE_SUBTRACT(NOW(),2,"days")>resolved}:
with day5_created=COUNT#truthy{DATE_SUBTRACT(NOW(),2,"days")<=created and DATE_SUBTRACT(NOW(),1,"days")>created}:
with day5_resolved=COUNT#truthy{DATE_SUBTRACT(NOW(),2,"days")<=resolved and DATE_SUBTRACT(NOW(),1,"days")>resolved}:
with day6_created=COUNT#truthy{DATE_SUBTRACT(NOW(),1,"days")<=created and DATE_SUBTRACT(NOW(),8,"hours")>created}:
with day6_resolved=COUNT#truthy{DATE_SUBTRACT(NOW(),1,"days")<=resolved and DATE_SUBTRACT(NOW(),8,"hours")>resolved}:
with day7_created=COUNT#truthy{DATE_SUBTRACT(NOW(),8,"hours")<=created}:
with day7_resolved=COUNT#truthy{DATE_SUBTRACT(NOW(),8,"hours")<=resolved}:
with maxth=MAX(day1_created, day1_resolved, day2_created, day2_resolved, day3_created, day3_resolved, day4_created, day4_resolved, day5_created, day5_resolved, day6_created, day6_resolved, day7_created, day7_resolved):
//25 is maximum working height
with heighth=25:
IF(itemtype!="issue",CONCAT(
"!https://www.example.com/images/Red.png|height=", FLOOR(day1_created/maxth*heighth), ",width=5!",
"!https://www.example.com/images/Green.png|height=", FLOOR(day1_resolved/maxth*heighth), ",width=5!",
"!https://www.example.com/images/Red.png|height=", FLOOR(day2_created/maxth*heighth), ",width=5!",
"!https://www.example.com/images/Green.png|height=", FLOOR(day2_resolved/maxth*heighth), ",width=5!",
"!https://www.example.com/images/Red.png|height=", FLOOR(day3_created/maxth*heighth), ",width=5!",
"!https://www.example.com/images/Green.png|height=", FLOOR(day3_resolved/maxth*heighth), ",width=5!",
"!https://www.example.com/images/Red.png|height=", FLOOR(day4_created/maxth*heighth), ",width=5!",
"!https://www.example.com/images/Green.png|height=", FLOOR(day4_resolved/maxth*heighth), ",width=5!",
"!https://www.example.com/images/Red.png|height=", FLOOR(day5_created/maxth*heighth), ",width=5!",
"!https://www.example.com/images/Green.png|height=", FLOOR(day5_resolved/maxth*heighth), ",width=5!",
"!https://www.example.com/images/Red.png|height=", FLOOR(day6_created/maxth*heighth), ",width=5!",
"!https://www.example.com/images/Green.png|height=", FLOOR(day6_resolved/maxth*heighth), ",width=5!",
"!https://www.example.com/images/Red.png|height=", FLOOR(day7_created/maxth*heighth), ",width=5!",
"!https://www.example.com/images/Green.png|height=", FLOOR(day7_resolved/maxth*heighth), ",width=5!"
))
The criteria for issue inclusion can be easily customized to your team's needs. As mentioned above, we recommend hosting image files locally.