Structure.Gantt allows you to display cross-project and cross-team work in a Gantt chart.
Is is built as an extension to Structure, the Jira app that allows to organize issues in adaptable, user-defined hierarchies.
Main Concepts
Every Gantt chart consists of two parts:
- Work breakdown structure, which defines the scope of work and which is built using Structure functionality
- The chart itself, which visualizes your tasks on the timescale, showing their start and finish dates, dependencies between them and other information
The chart is designed to be very configurable and allows you to use your Jira data (such as time tracking, date/time fields, links, etc) for visualizing your work on the timeline.
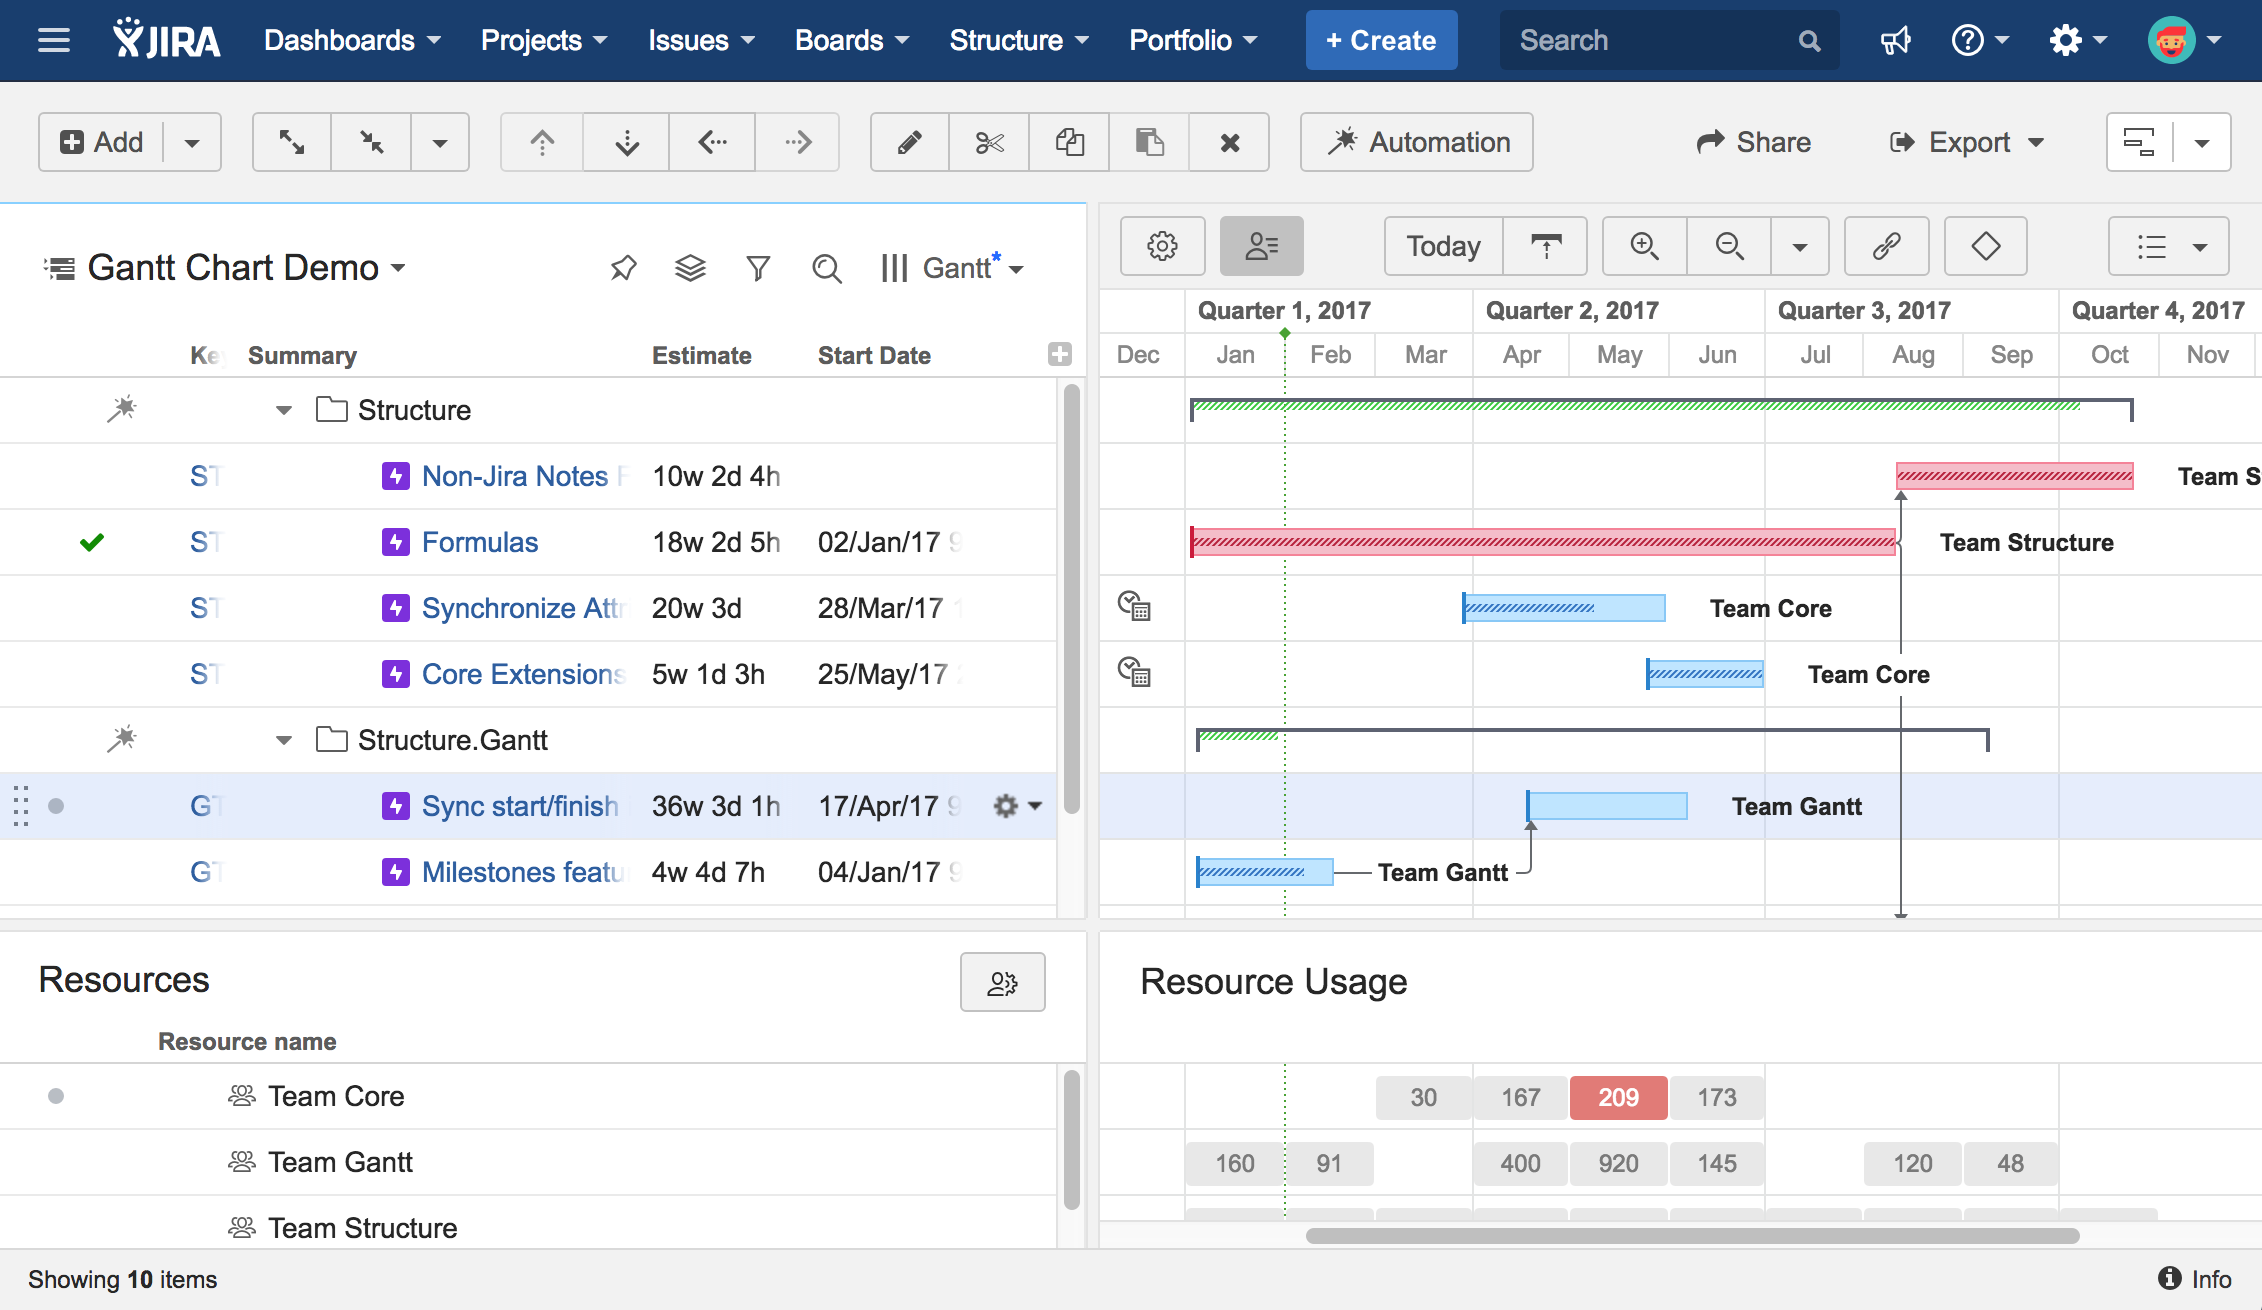
The chart consists of the following elements:
- The toolbar, which helps you navigate the chart, configure the view and do a few other things
- The timeline
- The chart itself with the tasks, dependencies and other useful information
You can schedule your tasks, change tasks estimate and dependencies right in the chart.
Configurations
You define how the Gantt chart should be build by creating a chart configuration - a set of parameters defining what should be used for estimation, scheduling, dependencies, resources, etc.
You can create multiple configurations and quickly switch between them for the same structure, or reuse any configuration in multiple structures.
Resource Management
Structure.Gantt allows you to visualize resource allocation and identify potential bottlenecks. For each individual resource you can define it's capacity, calendar, availability and the time zone.