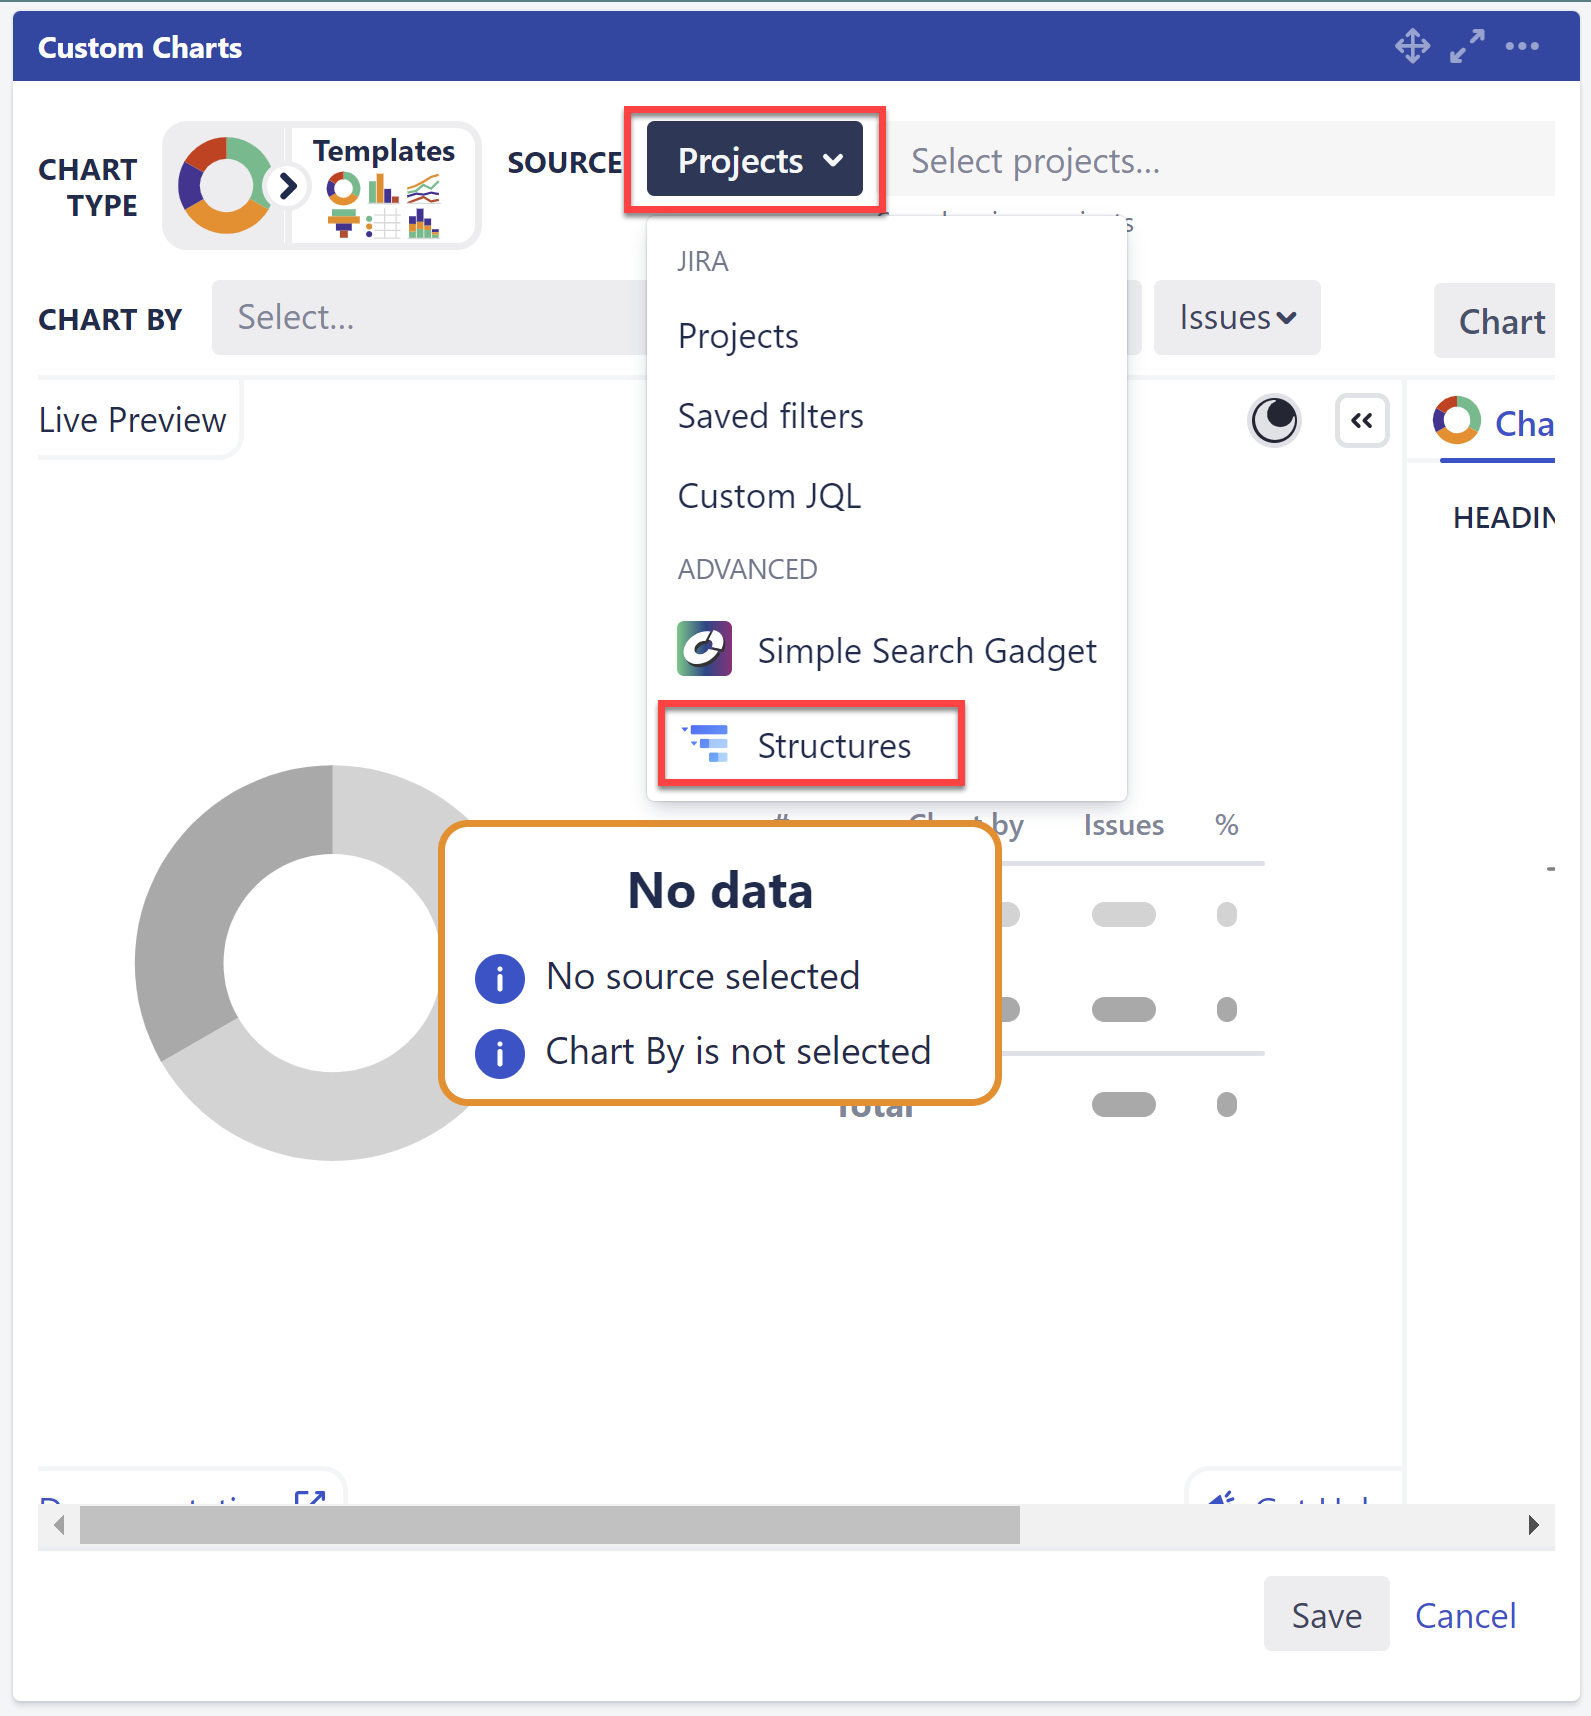
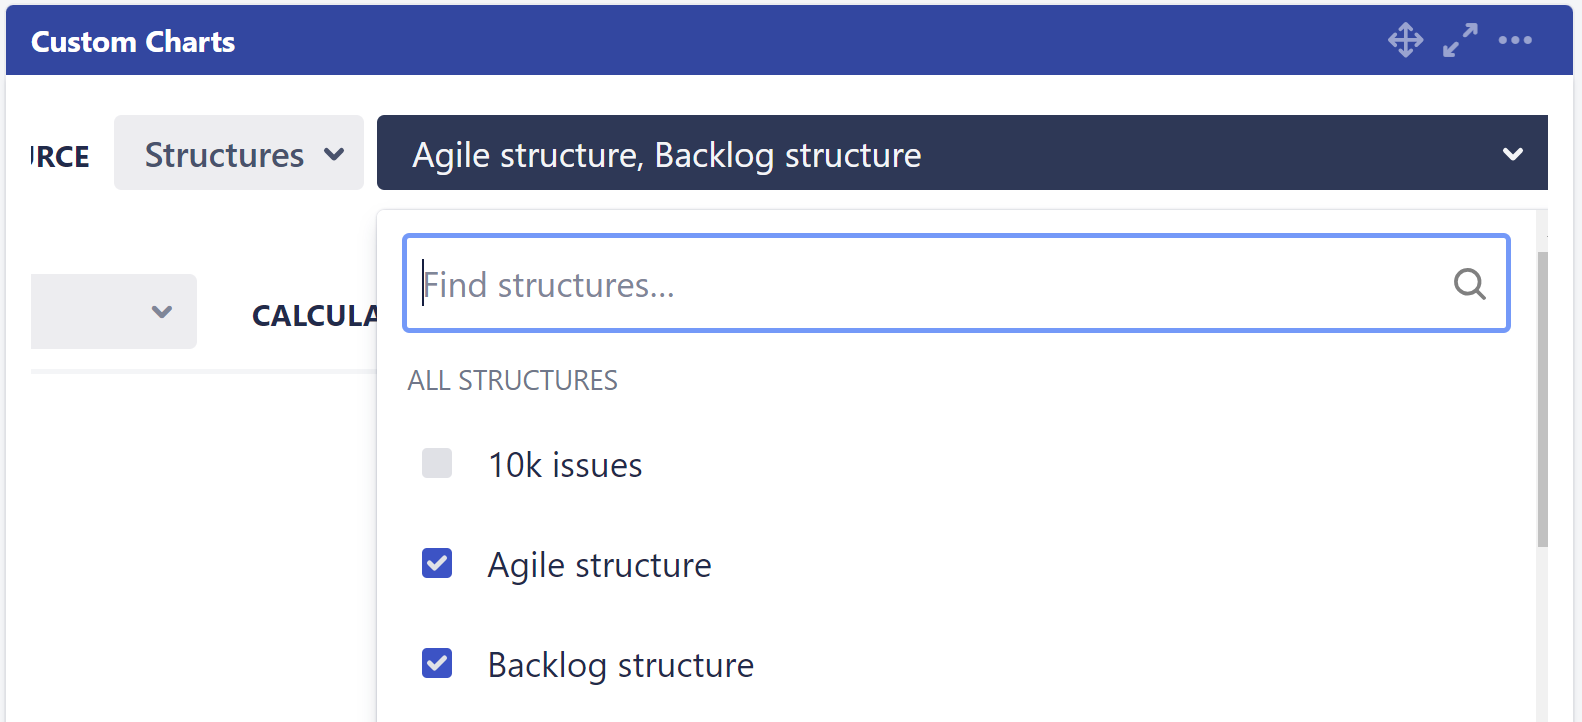
Turn your curated Structure data into visual reports. Our integration with Custom Charts for Jira allows you to easily build dashboard reports, charts, graphs, and more based on your structures.
Use Structure as the source for your Custom Charts
Turn Structure data into visual reports for stakeholders and leadership
Build custom reports for sprint progress, retrospectives, time in status, burndown,programs, customer satisfaction, workloads, age of issues, cumulative spend, and more