About Structure.Gantt
Structure.Gantt is a Structure extension, which brings planning and resource management features to structures.
Structure.Gantt adds the power of familiar Gantt charts to Jira, so you can instantly visualize issue dependencies and timelines, and understand resource allocations on a global scale.
This document makes a few assumptions:
- You are familiar with the basics of Structure add-on for JIRA and have it installed on your server. If you're new to Structure, please check it out on the Atlassian Marketplace or feel free to play with it on our Live Structure Demo Server.
- You are running Structure 4.6 or later. Structure.Gantt is not compatible with earlier versions.
- You have already installed Structure.Gantt. If not, you can download it from the Atlassian Marketplace or directly from our download page.
Creating Your First Gantt Chart
Gantt Chart Template
If you are not familiar with Structure yet, the easiest way to create your first Gantt chart is through the Gantt Chart Template:
- From the Jira menu at the top of your screen, select Structure | Create Structure
- Select Gantt Chart
- Click Next
In just a few steps, the wizard will help you define your structure and the parameters which will be used for building the Gantt chart, including task start and finish dates, duration, dependencies and more.
To learn more about creating charts with the Gantt Chart Template and how to tailor your charts for specific project needs, see Using the Gantt Chart Template.
For an Existing Structure
If you already have a structure you want to use for your Gantt chart, you can select one of the existing configurations (or create a new one) and edit the chart manually:
- Open Structure Board and switch to the structure that contains issues you would like to include in your chart
- Use the Toggle Panels menu to switch to either Gantt Chart or Gantt + Resources layout
- On the Create Gantt Chart screen, enter the Project Start Date and select one of the available configurations (or click Manage configurations to create a new configuration)
- Click Create Gantt Chart
Note: To be able to create Gantt charts (even for existing structures) you must have permissions to create new structures.
For more information about setting up your Gantt chart, see Gantt Chart Settings.
Gantt Chart Configuration
Gantt Chart configuration defines how the chart is built, including where the chart's information comes from and what fields are used to build it.
Structure.Gantt comes with a predefined "Default" configuration, with several predefined parameters. You can begin with the default configuration and customize it as necessary, or you can create your own custom configurations.
Creating a New Configuration
Structure.Gantt allows you to create custom chart configurations that can be used in multiple charts.
To create a new configuration:
- Click the Gantt Chart Settings button
 on the left side of the chart toolbar
 - Under Gantt Chart Configuration, click Manage configurations
- On the Gantt Chart Configurations screen, click Create New Configuration (You can also customize an existing configuration. Simply locate the desired configuration and click Edit.)
For more information, see Gantt Configuration in Detail.
Gantt Chart Elements
Once you define the configuration and save the settings, the Gantt chart opens.

Time Scale
You can quickly navigate or focus your timeline in a variety of ways:
- Zoom in or out to see more or less of your timeline
- Scroll horizontally or vertically
- Hold the Shift key and drag the chart with your pointer
- Focus in on the current date with the Today button
- Navigate to the current task with the Focused Task button (next to the Today button)
Start Date and Current Date
The project start date is indicated by a green vertical dashed line. The current date/time is indicated by an orange vertical line.
Mousing over the point at the top of either line will display the exact date.
Task Bars
Structure items are represented in the chart with bars.
- A task's position on the timeline is based either on its dependencies or on manually-set Start or/and Finish dates.
- If you have configured Gantt to track the progress of tasks, that will be shown inside the bar. To show/hide progress, use the Options menu in the Gantt toolbar.
- If a task is a part of the critical path, it is shown red. The rest of the tasks are blue. You can show or hide critical path highlighting using the Options menu in the Gantt toolbar.
Clicking the task bar will show the task details panel, which contains information about the task's timeline and resources.
Groups
If an element has children in a structure, it can be shown as a Group.
- A group's Start Date and Duration is calculated automatically, based on the Start Date and Duration of the elements it contains.
- If the group is an issue, which has its own Start Date and Duration values, they are ignored.
Dependencies
Dependencies are displayed as arrows between task bars.
- Click the arrow to show the Dependency Properties
- To show/hide dependency arrows, use the Options menu in the Gantt toolbar
For more information about managing dependencies, see Dependencies.
Display Options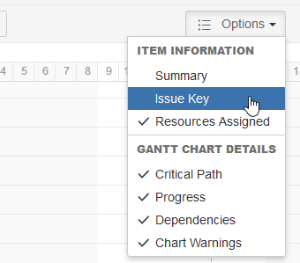
The Options menu in the Gantt toolbar allows you to select what elements should be shown in the chart.
These include:
- Summary
- Issue Key
- Resources
- Critical Path
- Progress
- Dependencies
- Chart Warnings (such as another time zone or different calendar)
Working with Gantt Charts
Adjusting Start/Finish Date, Manual and Automatic Scheduling
If you have enabled Manual Scheduling and configured fields for the Start and Finish Dates in the configuration, you can adjust them by dragging a task to the desired location. You can also adjust them by changing JIRA fields, either on the issue page or right in the structure (if you have added the columns containing the date fields to your view).
As you set the Start/Finish Date, the task is considered to be scheduled manually. This means it will stay at the defined position regardless of its dependencies.
To switch back to the Automatic scheduling mode, click the task to see the details panel and toggle the Scheduling option to Auto.
For more information, see Scheduling Tasks.
Adjusting Duration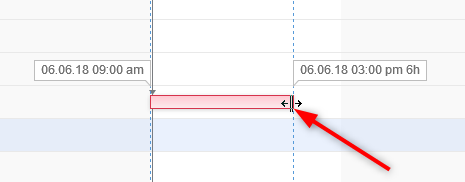
You can use Time Tracking, Story Points or both to calculate task duration.
- If you use Story Points, you will need to define how many hours are required to complete one story point.
- If no estimate is set, the default duration from the configuration is used.
To adjust a task's duration:
- Mouse over the right edge of the task bar you want to change
- Once the mouse pointer changes to the resize tool, click and drag left or right to set the desired duration
For more information, see Adjusting Duration.
Managing Dependencies
Dependencies are defined based on Issue Links. Changing dependencies creates or removes links between issues.
To create a Finish to Start dependency:
- Mouse over the task bar until a black circle appears to the right of the bar
- Press the circle and drag your dependency line to the task you want to link to
To create other types of dependencies, use the Link button in the toolbar.
To remove a dependency:
- Click the link arrow between two tasks to display the Dependency Properties
- Click Remove
For more information about working with and configuring dependencies, see Working with Dependencies.
Critical Path
Tasks included in the critical path are highlighted in red. To switch off this highlighting:
- Select the Options menu in the Gantt toolbar
- Uncheck Critical Path
Conflicts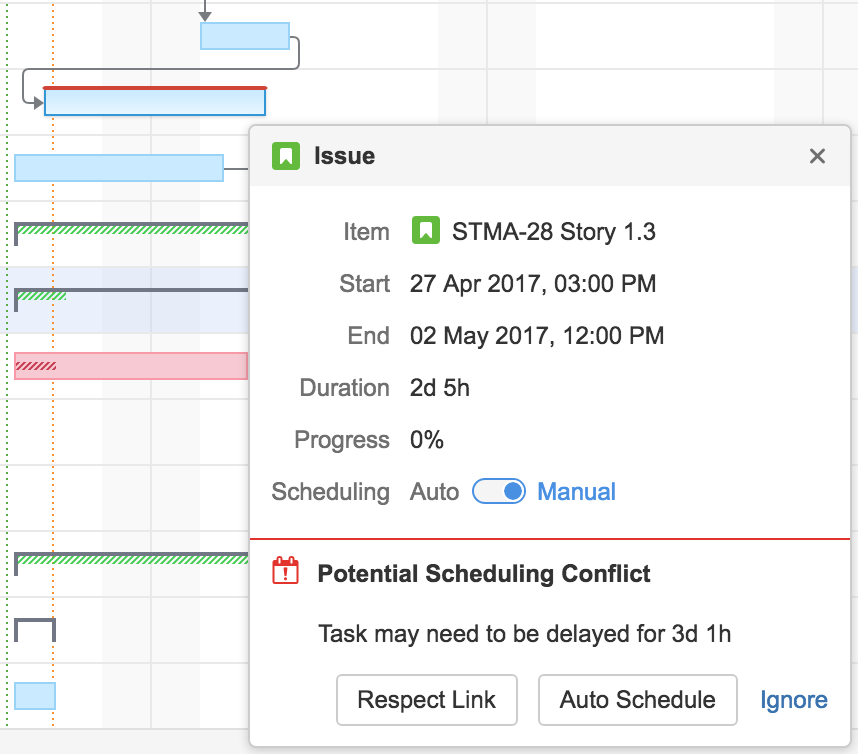
Structure.Gantt highlights any scheduling conflicts with a red line (see picture). For example, for finish to start dependencies, if a task is scheduled for a date earlier than its predecessor's Finish Date, Gantt will highlight this conflict.
To deal with the conflict, click the task and select one of the following actions:
- Respect Link. This will change the task Start Date to coincide with the predecessor's Finish Date. The task will stay in the Manual Scheduling mode.
- Auto Schedule. This will switch the task to the Automatic Scheduling mode, clearing its Start Date or Finish Date and scheduling the task based on its predecessor and the dependency type.
- Ignore. This will remove the highlighting from the task bar, but the conflict will stay and the conflict details will remain in the details panel.
Status Bar
If there are any inconsistencies in the source data (for example, a cycle of dependencies), the Gantt Info link will be shown on the right side of the Structure status bar (next to the Structure Info link ![]() at the bottom of the screen). Click the link to see details of the inconsistencies.
at the bottom of the screen). Click the link to see details of the inconsistencies.
If you do not have permission to edit the Gantt chart, that information will be displayed in the Status Bar as well.
Resources
Structure.Gantt allows you to assign specific resources, such as a person or a team, to tasks. Once you assign a resource to a task, Structure.Gantt will calculate the resource usage throughout the project.
Resources are assigned to tasks based on a specific Jira field or Structure attribute. Many customers select the Assignee field or create a custom field, such as a "Team" field. However, you can use almost any JIRA field or Structure attribute (including one calculated through Formulas).
To set how resources are assigned:
- Click the Gantt Chart Settings button

- Under Gantt Chart Configuration, click Edit
- On the Resources page, under Resource Assignment, select the attribute that will be used to assign resources.
- (Optional) Set the default resource capacity, calendar, and time zone
For more information, see Resources and Working with Resources.
Resource Allocation Chart
Once resources are assigned to tasks, Structure.Gantt can display the number of hours assigned to each resource at a given time.
To display the Resource Allocation Chart, click the Resources button or switch Layout to "Gantt + Resources."
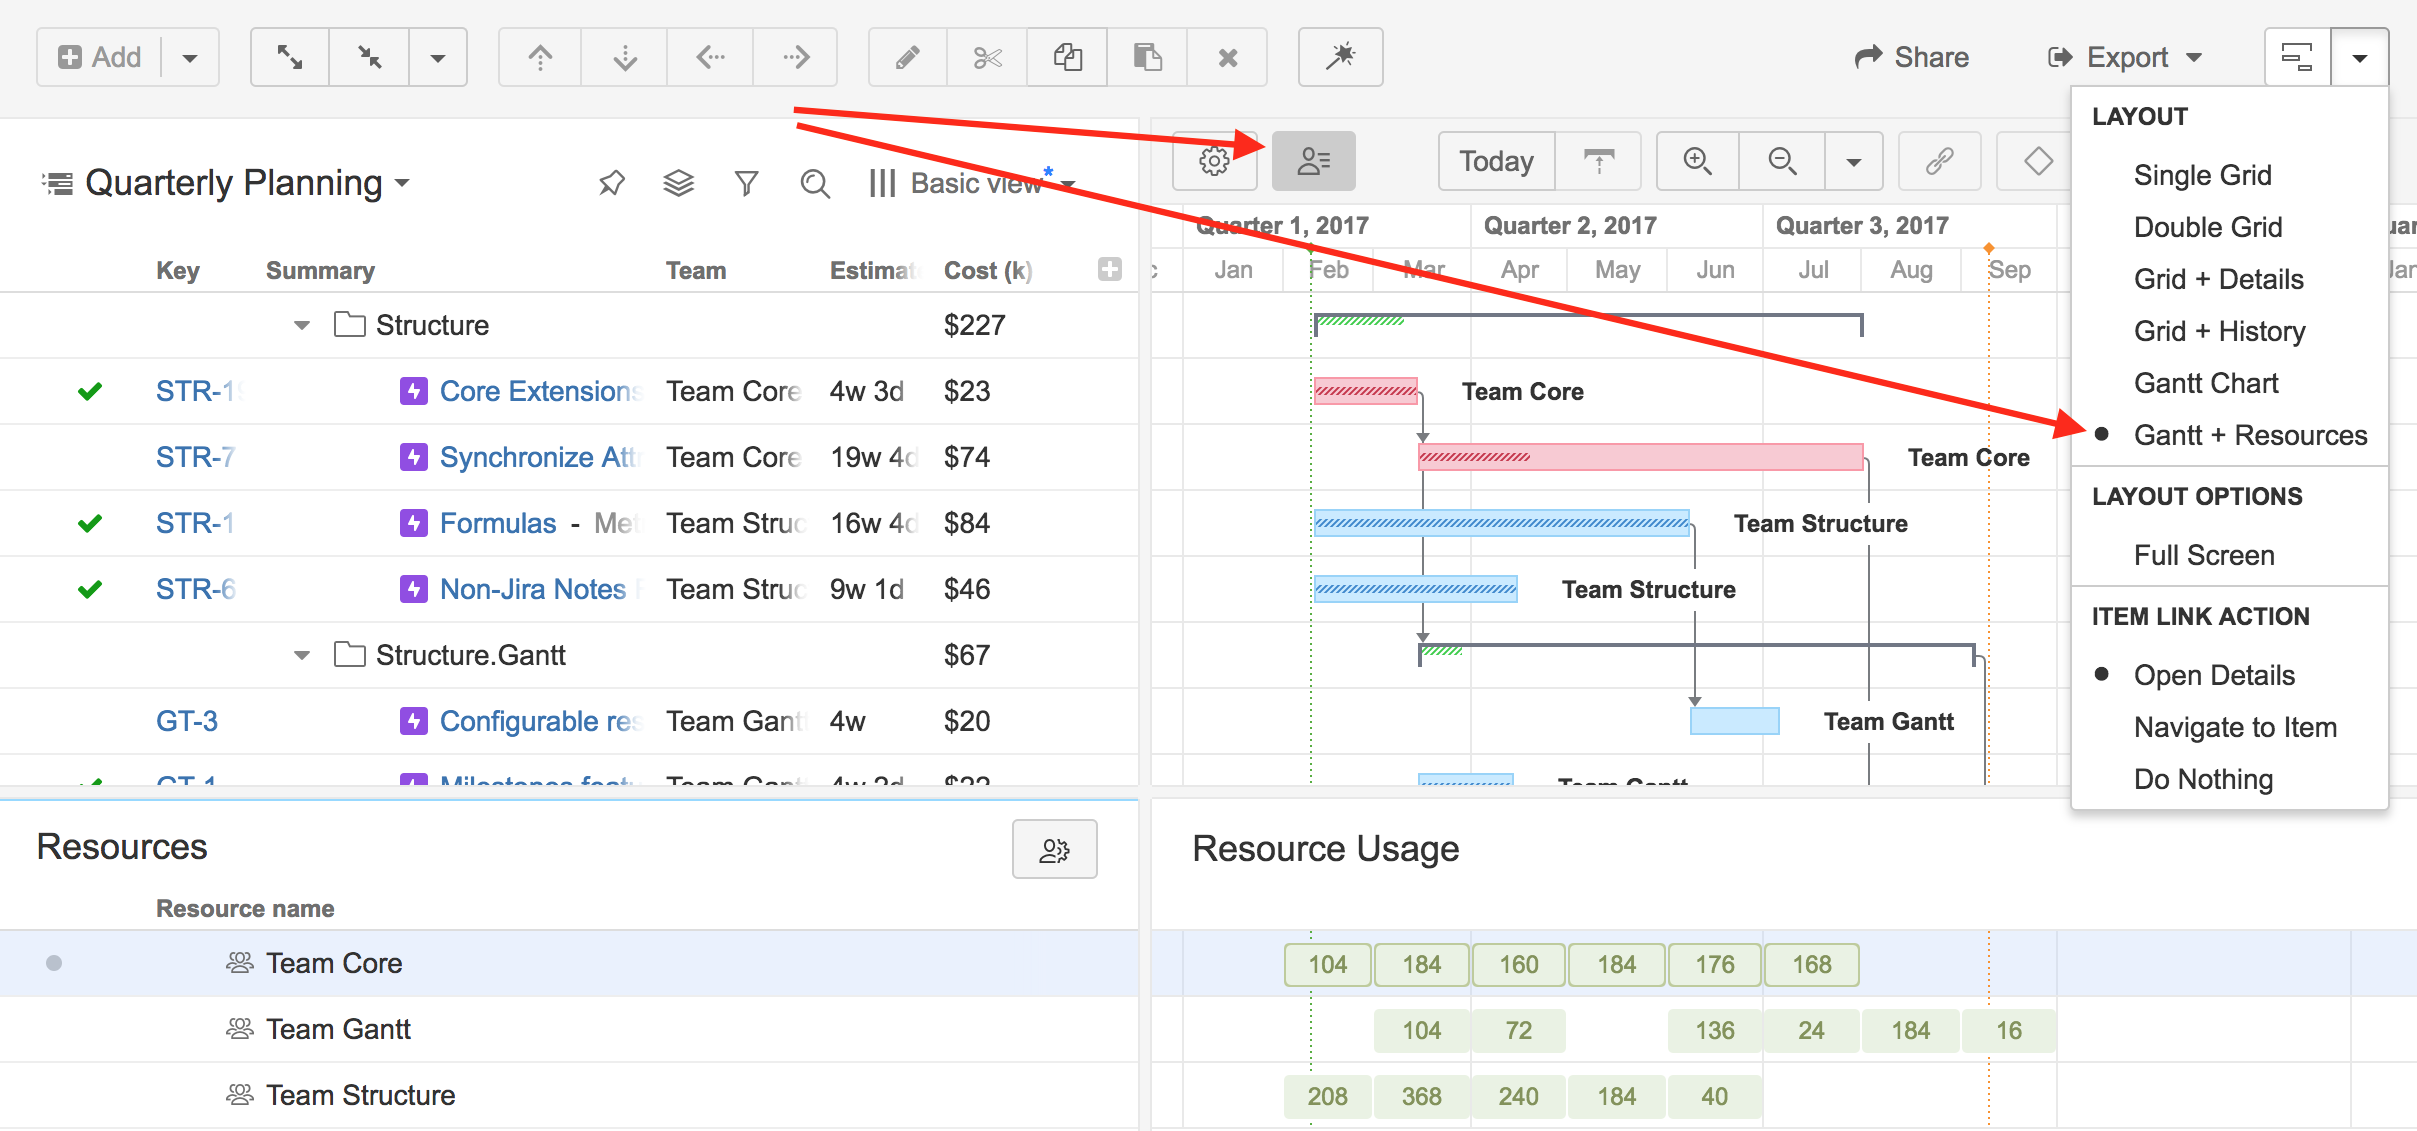
For more information about working with resources, calendars and units, see Working with Resources.
Next Steps
For a more in-depth look at using Structure.Gantt, get started with our complete guide at Creating Your First Gantt Chart.