The following section will walk you through the elements of your Gantt chart panel and explain how to accomplish many common tasks.
Toolbar
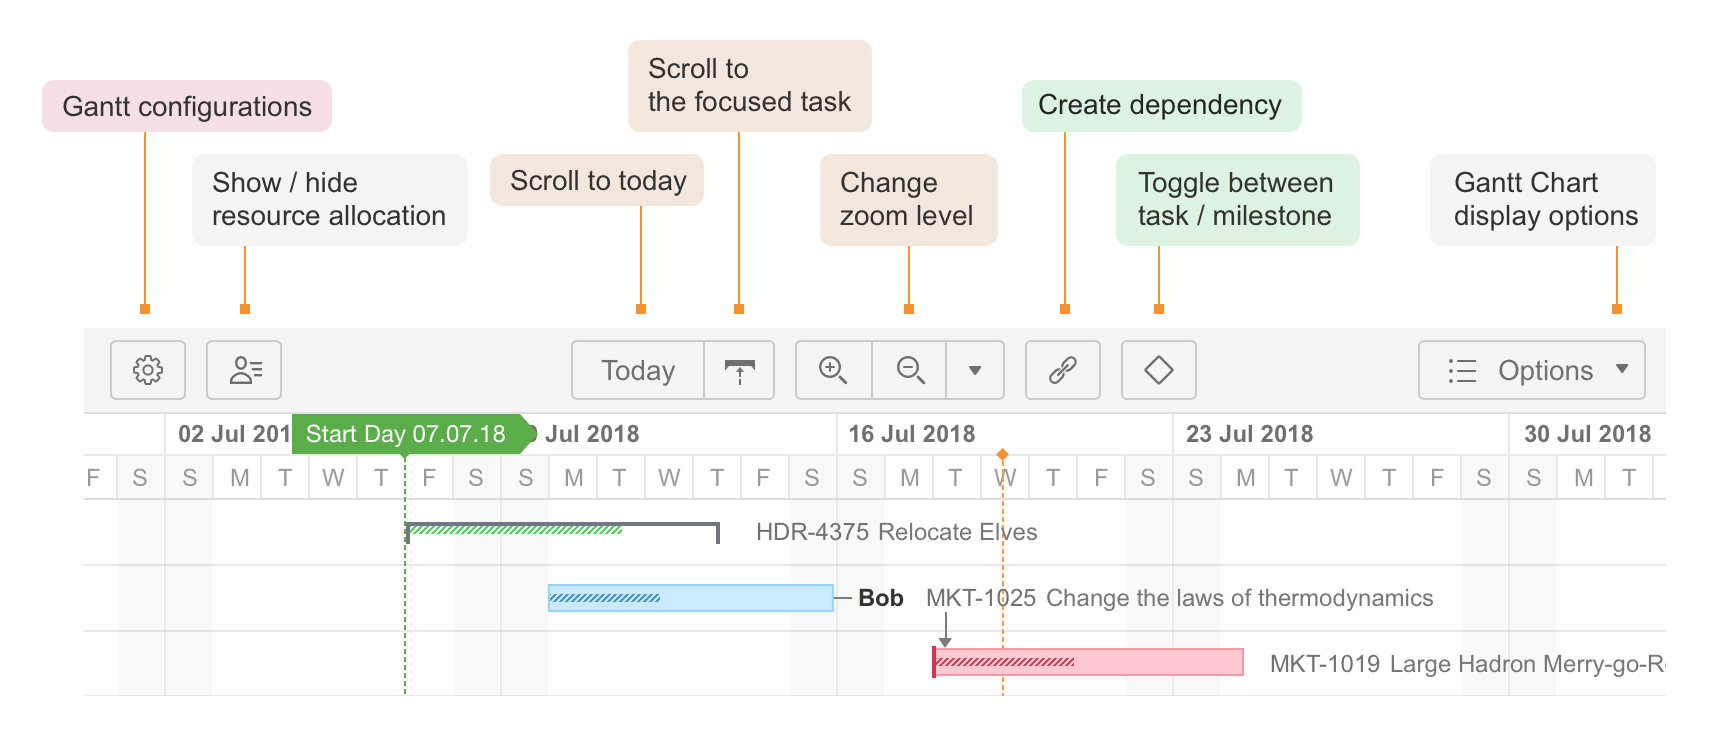
Using the toolbar, you can:
- Access Gantt Chart Settings
- Adjust the chart's appearance
- Select which elements are shown within your timeline
- Create dependencies
- Turn tasks into milestones
Timeline
Your timeline contains visual representations of tasks, dependencies, progress, milestones and other key dates.
It is also where you will do most of your work. As you saw in Working with Tasks, you can adjust tasks and dependencies directly from your timeline.
Time Scale
You can quickly navigate or focus your timeline in a variety of ways:
- Zoom in or out to see more or less of your timeline
- Scroll horizontally or vertically
- Hold the Shift key and drag the chart with your pointer
- Focus in on the current date with the Today button
- Navigate to the current task with the Focused Task button (next to the Today button)

Zoom Level
To adjust the zoom level of your chart, use the + or - magnification buttons in the toolbar. You can also zoom in or out using your mouse wheel, by holding down the ctrl button (cmd on macs).
To view issues based on a specific time scale, such as weekly or monthly, use the drop-down menu beside the magnification buttons.

Start Day and Current Date
The project start date is indicated by a green vertical dashed line. The current date/time is indicated by an orange vertical line.
Mousing over the point at the top of either line will display the exact date.

Fix Versions and Sprints
You can also include markers for fix versions and sprints in your Gantt chart.
- Fix Version markers display version names. By hovering over a marker, you can also see the release date and project key (if versions are shown for multiple projects).
- Sprints can be visualized based on sprints already defined in a specified board, or you can display anticipated sprints by specifying the day of the week sprints start and sprint duration. (See Gantt Chart Settings for instructions on specifying sprint timelines.)
- Hovering over a sprint marker will display the sprint name for existing sprints or the sprint number for future sprints, along with the sprint date. Active sprints are marked with a solid line.

Task Bars
Structure items are represented in the chart as task bars.
- A task's position on the timeline is based either on its dependencies or on manually-set Start or/and Finish dates.
- If you have configured Gantt to track the progress of tasks, that will be shown inside the bar. To show/hide progress, use the Options menu in the Gantt toolbar.
- If a task is a part of the critical path, it is shown red. The rest of the tasks are blue. You can show or hide critical path highlighting using the Options menu in the Gantt toolbar.
Task Details Panel
Clicking a task bar will display the task details panel, which contains information about the task's timeline and resources.

The Task Details Panel displays the following details about a task:
- Start and Finish dates - These values can be set manually or can be calculated based on of the task's duration and dependencies.
- Work - The effort required to complete the task.
- Duration - The time it takes to complete the task.
- Progress - This can be calculated based on the task's own progress or based on its child issues.
- Scheduling - Shows whether the task is scheduled manually (the start or end date or both are set manually) or automatically (based on the project start day, duration and dependencies).
- Slice - If the task's appearance or behavior is based on a Slice configuration, the slice name is listed here.
- Maximum Units - Shows the maximum resource capacity which can be used on this task. For example, if a resource has capacity of 5, but the Max Unit setting is 1, only 1/5 of the resource will be used to work on this task. If the Max Unit is set to 5 or more, the entire resource will be used and the task can be done 5 times faster. (See Resources for more information about assigning and tracking resources.)
- Resources - Shows the resource assigned to the task, the resource time zone and calendar.
Groups
If an element has children in a structure, it can be shown as a Group.
- A group's Start Date and Duration are calculated automatically, based on the Start Date and Duration of the elements it contains.
- If the group is an issue, which has its own Start Date and Duration values, they are ignored.

In order to display child/parent relationships as a group, you first need to enable grouping in Gantt configuration.
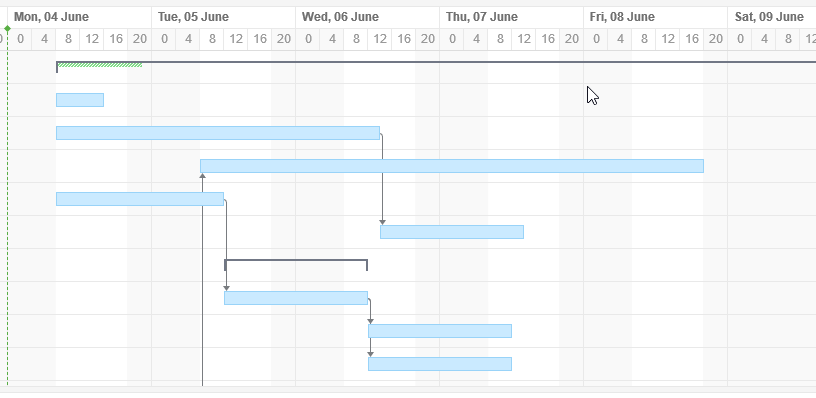
Dependencies
Dependencies are displayed as arrows between task bars.
- Click the arrow to show the Dependency Properties
- To show/hide dependency arrows, use the Options menu in the toolbar
For more information about managing dependencies, see Dependencies.
Critical Path
If a task is part of the critical path, it will have a red task bar.

To switch off Critical Path highlighting:
- Select the Options menu in the toolbar
- Uncheck Critical Path
Display Options

The Options menu in the Gantt toolbar allows you to select what elements should be shown in the chart.
These include:
- Summary
- Issue Key
- Resources
- Critical Path
- Progress
- Dependencies
- Chart Warnings (such as another time zone or different calendar)
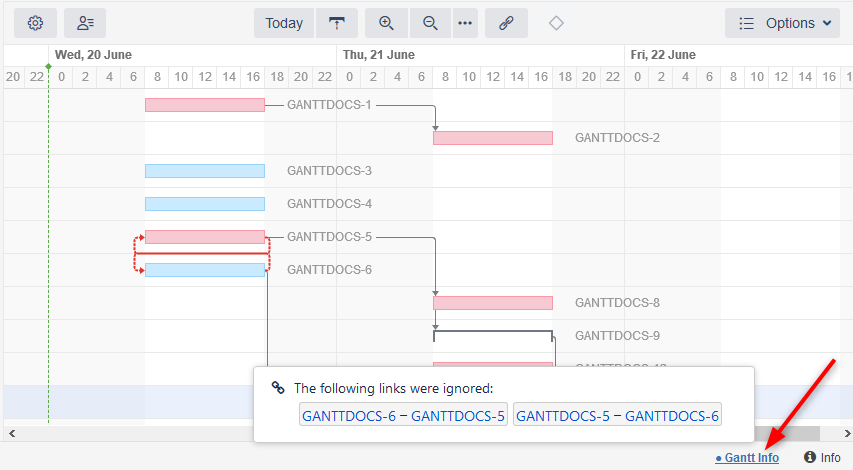
Status Bar
If there are any inconsistencies in the source data (for example, a cycle of dependencies), the Gantt Info link will be shown on the right side of the Structure status bar (next to the Structure Info link ![]() at the bottom of the screen). Click the link to see details of the inconsistencies.
at the bottom of the screen). Click the link to see details of the inconsistencies.
If you do not have permission to edit the Gantt chart, that information will be displayed in the Status Bar as well.